Coreties Research
Europe’s boxes still cross the Atlantic. Fewer of them land in Florida.
Transatlantic routing after the tariff deal: what US customs data shows for Q3 2026

Key findings
- Containers from the EU and UK discharged in Florida fell 29% in Q3 2026, from 47,670 to 33,940.
- Savannah went the other way: up 25%, from 51,265 to 64,063.
- Total Europe-loaded containers to the US rose 2.1% to 603,695. US Census shows imports from the EU up 2.3% in value.[2]
- European-origin boxes for Florida loaded directly in Europe fell 40%; the share arriving through a hub outside Europe rose from 21% to 33%.
A year after the EU and the US settled on a 15% tariff ceiling, and three months after that framework entered into force on 1 July 2026[1], the obvious question was whether European exports to the US had recovered. US customs data says yes, modestly. The more interesting answer is about where those containers now arrive.
We counted every container loaded at a European port (excluding Turkey and Russia) that arrived in the US between July and September, from ocean import bills of lading, counting each container once. Q3 2026 came to 603,695 containers, up 2.1% on 591,018 in Q3 2025 and still below the 623,467 of Q3 2024. US Census shows imports from the EU up 2.3% in value over the same months[2], and Container Trades Statistics has Europe’s container exports up 3% for the quarter[3]. Three independent measures agree: the trade held steady.
That recovery came off a weak base. In November 2025 Sea-Intelligence warned that westbound transatlantic demand had turned negative and that capacity was outrunning it[4], and CTS counted Europe–North America volumes down 4.5% in September 2025[5]. By April 2026 the decline had nearly stopped[6]. Tariff policy kept changing throughout. The Supreme Court struck down the IEEPA tariffs on 20 February 2026 and a temporary 10% Section 122 surcharge followed[7]. On 24 July, Section 301 duties replaced it, set so that EU goods pay 10% including the normal duty[8][9]. For most European goods, Q3 2026 came in under a lower headline rate than Q3 2025.
The shift inside the total
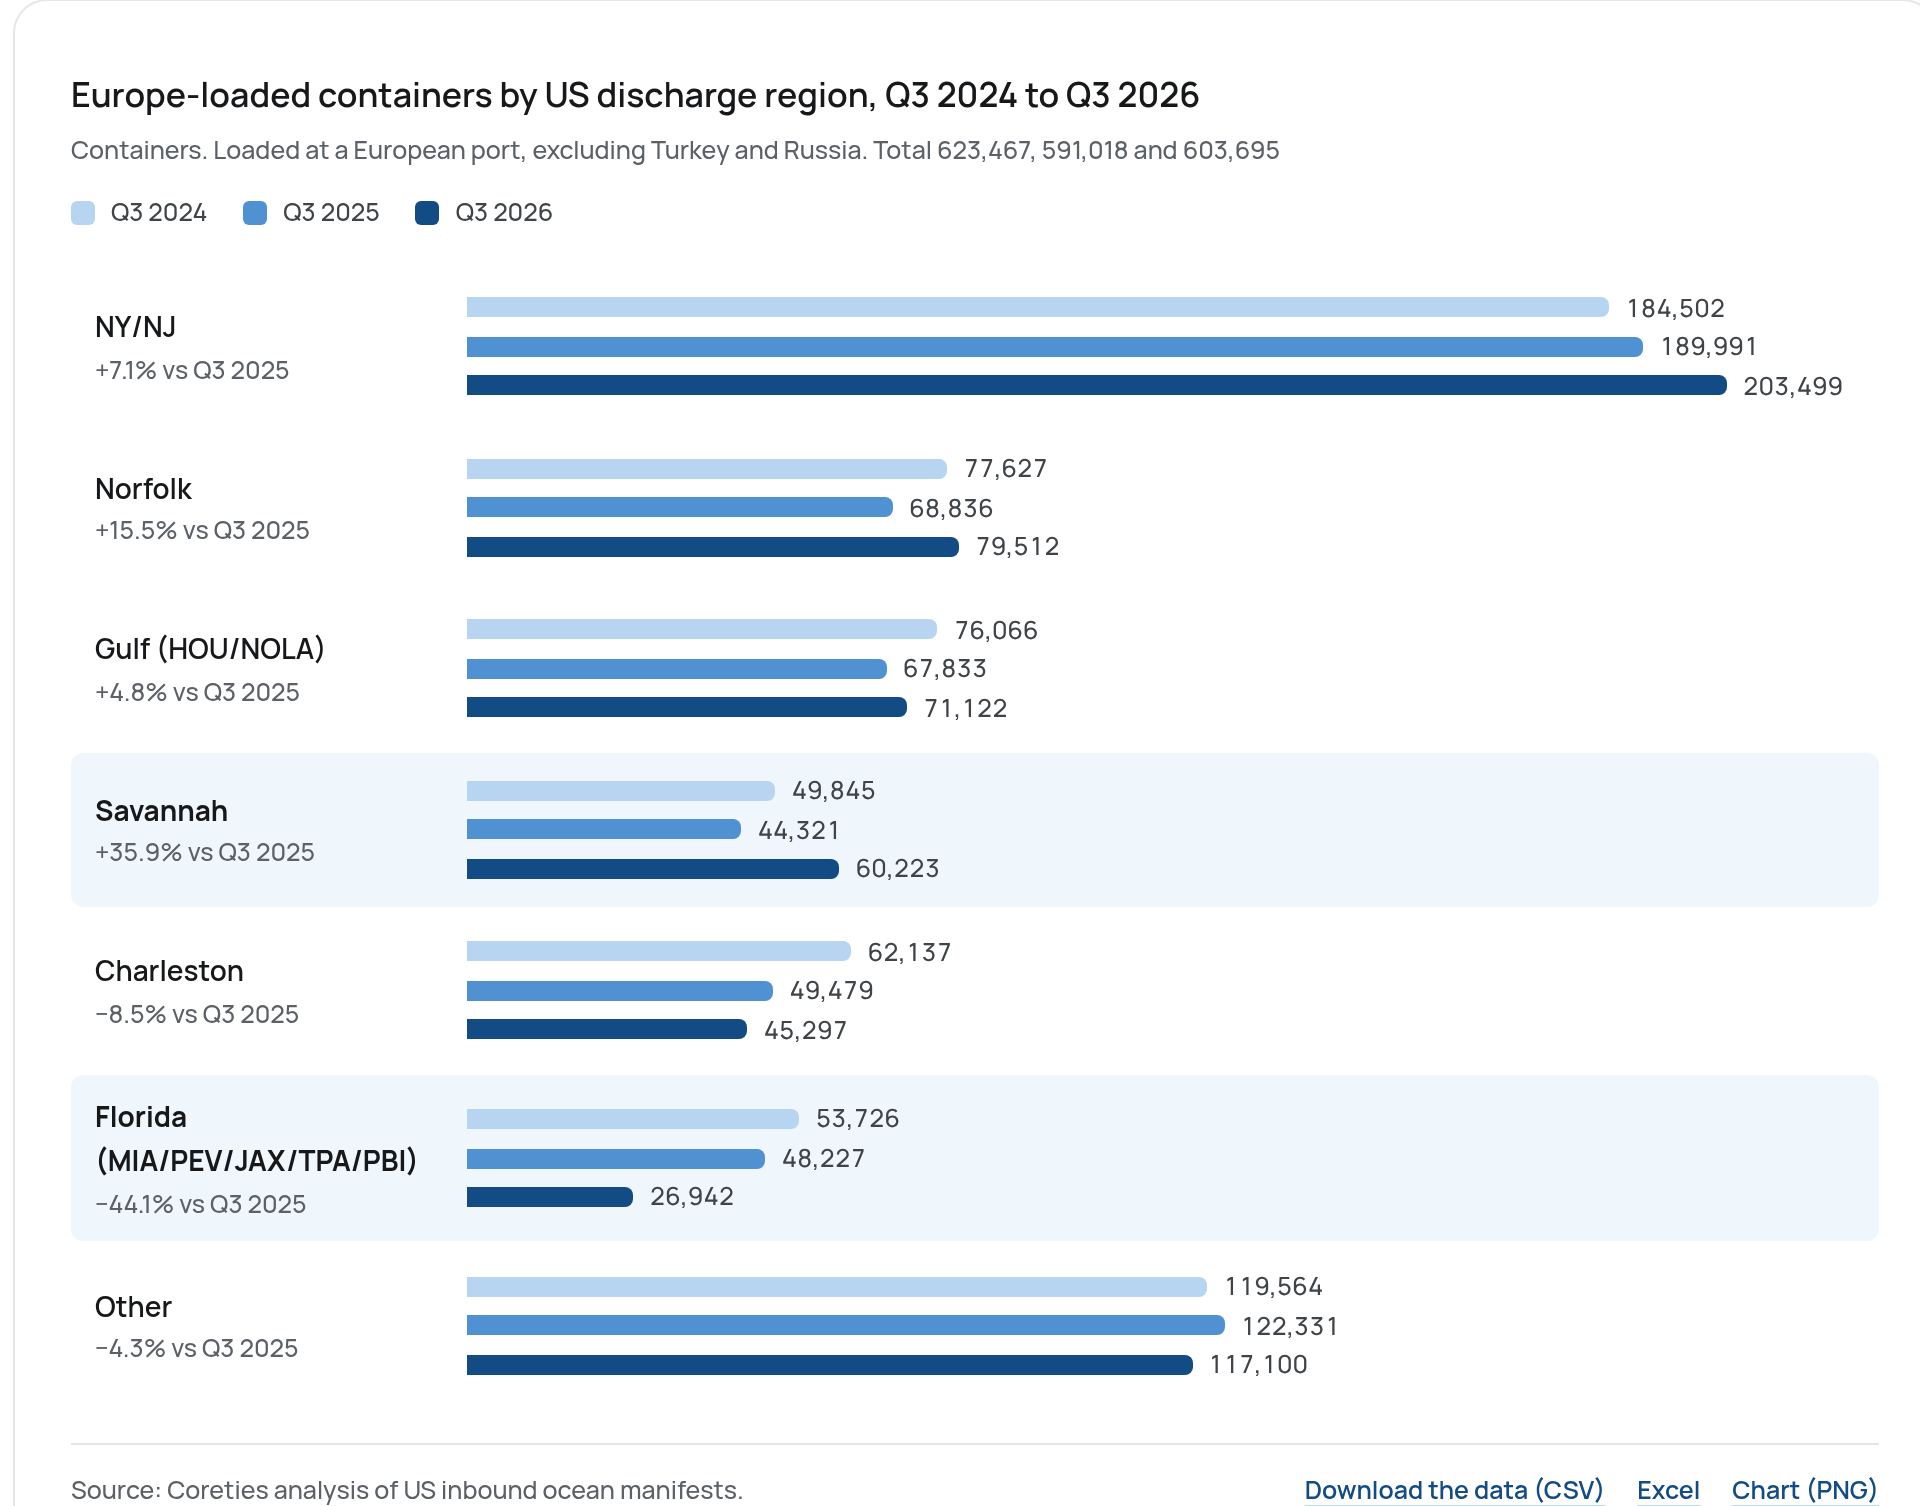
Total volume barely moved, but where it landed did. Containers that started their journey in the EU or UK and were discharged in Florida (Miami, Port Everglades, Jacksonville, Tampa and West Palm Beach) fell from 47,670 to 33,940, down 29%. Savannah went the other way, from 51,265 to 64,063, up 25%.
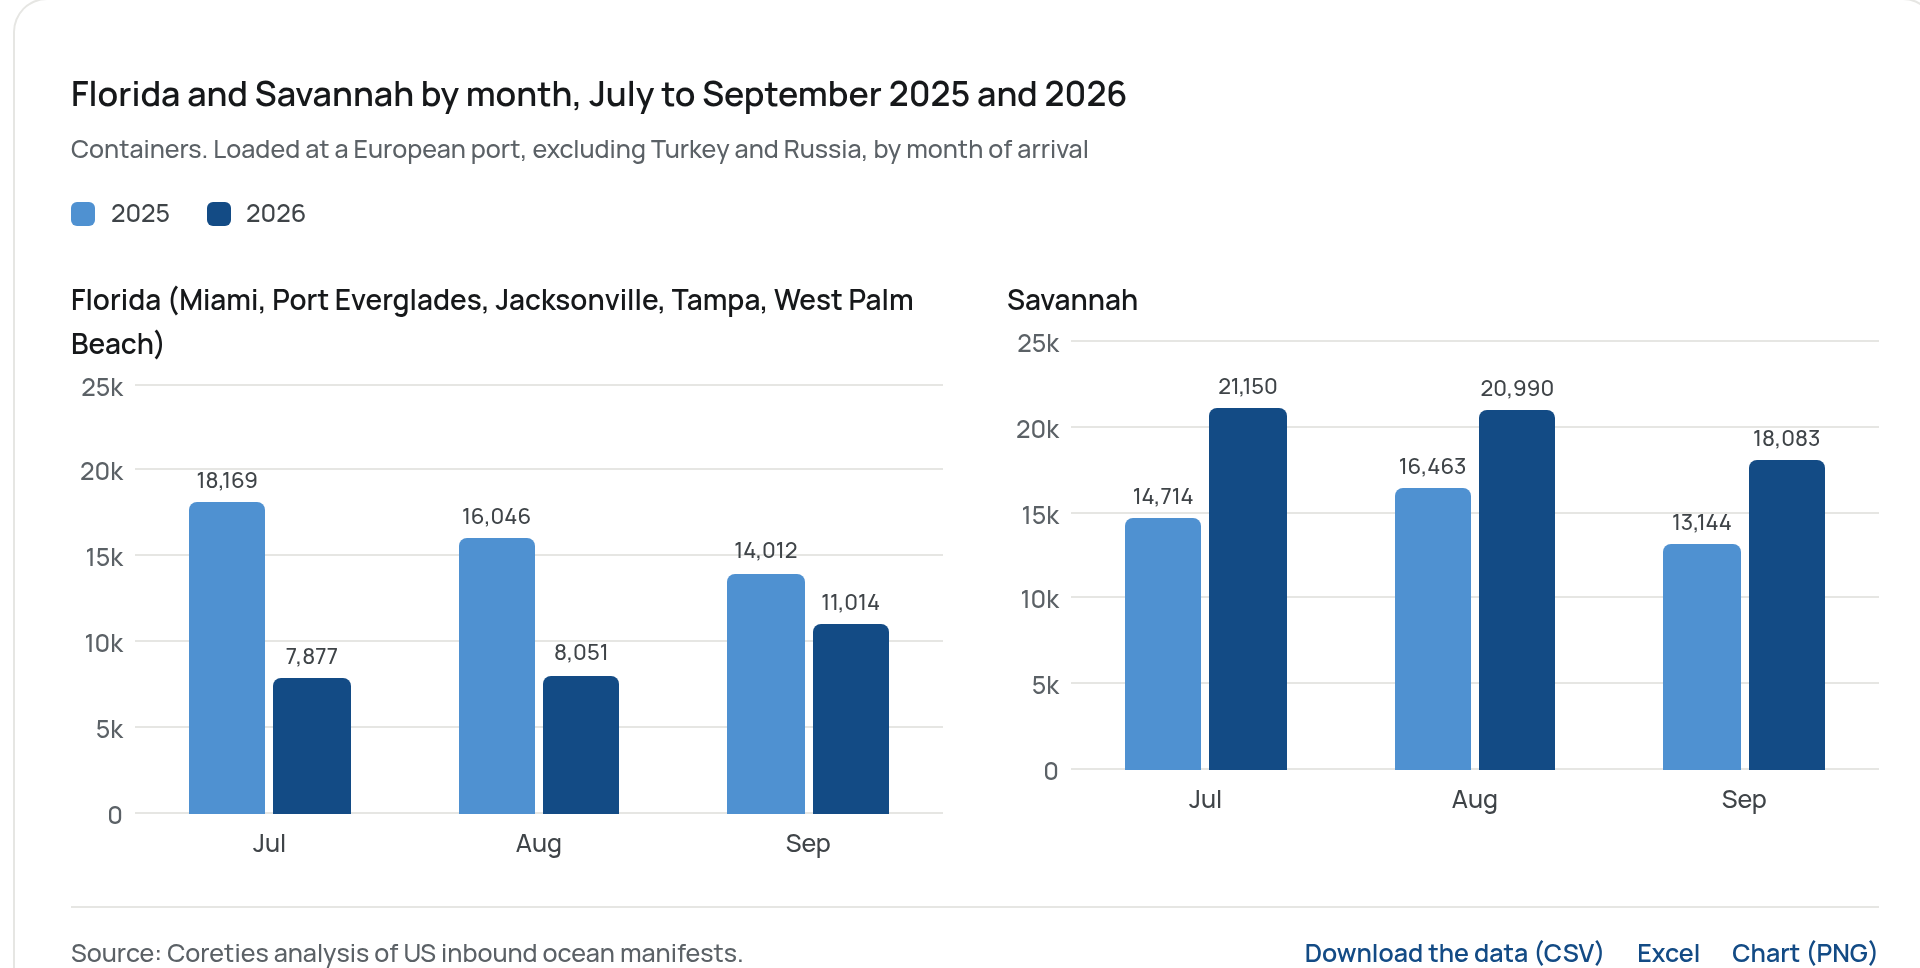
The way that cargo travels changed even more. European-origin boxes for Florida that were loaded directly at a European port fell from 37,682 to 22,624, down 40%. Over the same period, the share reaching Florida through a hub outside Europe grew from 21% to 33% of the flow, led by Freeport in the Bahamas, which more than doubled (1,238 to 3,112). Counted by loading port alone, Europe’s direct calls into Florida fell 44%, while Savannah’s rose 36%. Florida’s decline is steady month by month: 18,169 Europe-loaded containers in July 2025 against 7,877 in July 2026, then 16,046 against 8,051 in August and 14,012 against 11,014 in September.
Europe-loaded containers by US discharge region, Q3 2024 to Q3 2026
Containers. Loaded at a European port, excluding Turkey and Russia. Total 623,467, 591,018 and 603,695
Show the numbers as a table
| Discharge region | Q3 2024 | Q3 2025 | Q3 2026 | Change 2025 to 2026 |
|---|---|---|---|---|
| NY/NJ | 184,502 | 189,991 | 203,499 | +7.1% |
| Norfolk | 77,627 | 68,836 | 79,512 | +15.5% |
| Gulf (HOU/NOLA) | 76,066 | 67,833 | 71,122 | +4.8% |
| Savannah | 49,845 | 44,321 | 60,223 | +35.9% |
| Charleston | 62,137 | 49,479 | 45,297 | −8.5% |
| Florida (MIA/PEV/JAX/TPA/PBI) | 53,726 | 48,227 | 26,942 | −44.1% |
| Other | 119,564 | 122,331 | 117,100 | −4.3% |
| Total | 623,467 | 591,018 | 603,695 | +2.1% |
Florida and Savannah by month, July to September 2025 and 2026
Containers. Loaded at a European port, excluding Turkey and Russia, by month of arrival
Florida (Miami, Port Everglades, Jacksonville, Tampa, West Palm Beach)
Savannah
Show the numbers as a table
| Month | Florida 2025 | Florida 2026 | Savannah 2025 | Savannah 2026 |
|---|---|---|---|---|
| Jul | 18,169 | 7,877 | 14,714 | 21,150 |
| Aug | 16,046 | 8,051 | 16,463 | 20,990 |
| Sep | 14,012 | 11,014 | 13,144 | 18,083 |
One carrier accounts for most of it. MSC’s Europe-loaded containers to Florida fell from 31,122 to 12,994, and its containers to Savannah rose from 10,488 to 23,779. That’s about 85% of Florida’s loss and 84% of Savannah’s gain.
Data and method
US Customs ocean import bills of lading, arrivals 1 July to 30 September of each year. Each container counted once per month across bills, using the latest bill filed for it. “Europe-loaded” means the foreign port of lading is in Europe, excluding Turkey and Russia. “European-origin” means the place of receipt is in the EU or UK. Florida is Miami, Port Everglades, Jacksonville, Tampa and West Palm Beach. Discharge port is as declared. Container counts, not TEU. Late-filed bills still arrive for recent months, so figures can move slightly. Data as of 19 November 2026. No importer or customer data is identified.
The chart data, as CSV and Excel:
- Europe-loaded containers by US discharge region, Q3 2024 to Q3 2026discharge-regions-q3-2024-2026.csv
- US-bound containers by European loading port, Q3 2025 and Q3 2026european-loading-ports-q3-2025-2026.csv
- Europe-loaded containers to Florida and Savannah by month, Q3 2025 and Q3 2026florida-savannah-monthly-q3-2025-2026.csv
Cite as: Iaccarino, T. (2026). “Europe’s boxes still cross the Atlantic. Fewer of them land in Florida.” Coreties Research, coreties.com/research/europe-us-container-routing-q3-2026.
References
- [1]European Commission, “The EU-US trade deal” commission.europa.eu
- [2]US Census, Trade in goods with the European Union census.gov
- [3]Container Trades Statistics, September 2026 press release, 6 Nov 2026 containerstatistics.com
- [4]Sea-Intelligence, 7 Nov 2025 sea-intelligence.com
- [5]The Loadstar, 26 Nov 2025 theloadstar.com
- [6]The Loadstar, 29 Jun 2026 theloadstar.com
- [7]USTR, statement on the Supreme Court IEEPA decision, 20 Feb 2026 ustr.gov
- [8]USTR, “USTR Takes Action in Forced Labor Section 301 Investigations”, 23 Jul 2026 ustr.gov
- [9]Alston & Bird, “USTR Finalizes and Imposes 10 to 12.5 Percent Section 301 Forced Labor Duties” alstontrade.com
Coreties tracks these lanes for freight forwarders. See the data.