Coreties Research
Europe’s bulk chemical shipments to the US fell by two-thirds. Tank containers held steady.
EU chemical exports to the US by sea, air and road, and what US ship manifests show for tankers and tank containers, January to August 2026

Key findings
- From January to August 2026 the EU shipped 19% fewer tonnes of chemicals to the US by sea than in the same months of 2024: 4.49 million tonnes against 5.52 million. Sea carries 95% of the weight.
- Six bulk liquids that mostly travel by tanker account for all of the drop. Biodiesel, caustic soda, benzene, acetone, alcohols and sulphuric acid fell 67% together. Every other chemical rose 3%.
- US ship manifests show the same split. Chemical tanker parcels loaded at EU ports fell 45% from March to August. Tank container loads didn’t move.
- By value the story is air freight. Hormones from Ireland lifted EU chemical exports by air to €56.8 billion in January to August 2025. In 2026 the air total was €9.5 billion.
Chemicals are one of the EU’s largest exports to the United States, and they travel by every mode there is. Basic chemicals go in parcel tankers, fertilisers in bulk carriers, plastics and paints in dry containers, smaller liquid lots in tank containers, and drug ingredients worth millions a kilo by air. A single total hides most of that, so we split it.
Eurostat publishes EU exports by mode of transport: sea, air, road, rail and post, by product, in euros and kilograms[1]. We took chemicals as HS chapters 28 to 39, without chapter 30, which holds finished pharmaceuticals. Eurostat doesn’t say whether a sea shipment went in a container or a tanker. US ship manifests do. Each bill of lading records the cargo type, the port of loading and the container, so we used them for that split. We compare 2026 with 2024 rather than 2025, because early 2025 was distorted by companies shipping ahead of US tariffs.
By value: an air freight boom, then a bust
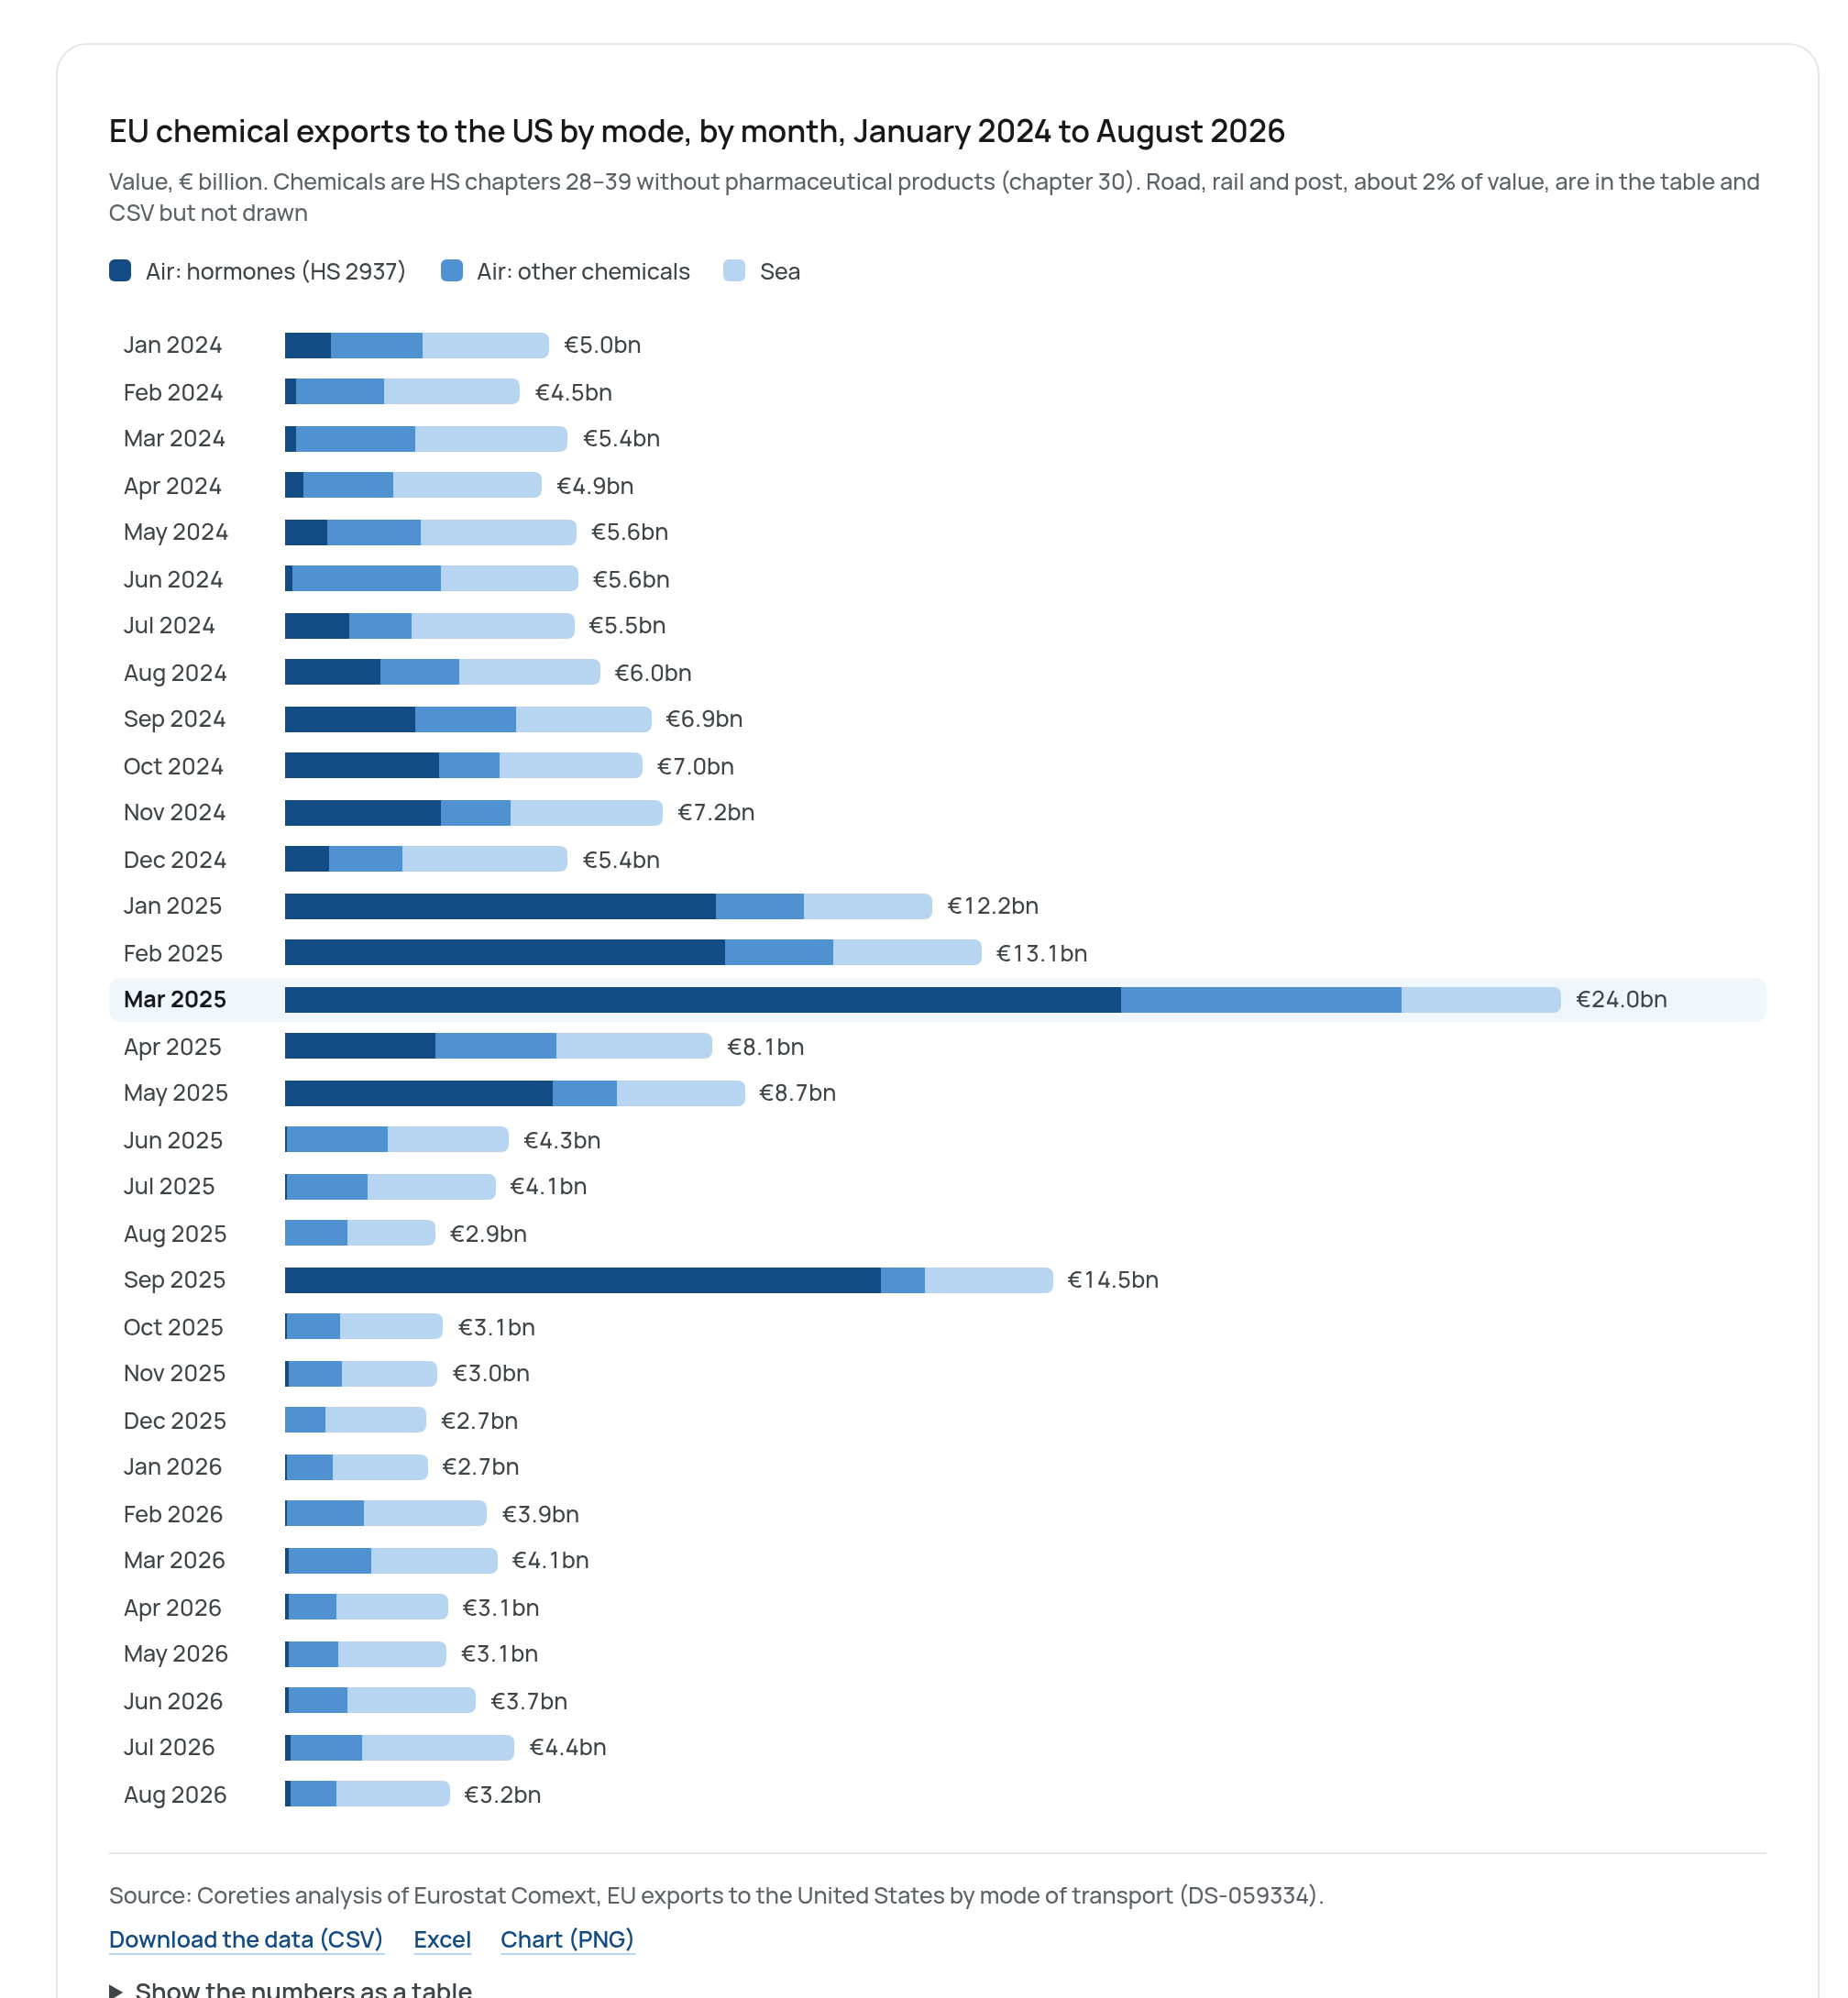
Eurostat’s export statistics show the EU sent €42.5 billion of chemicals to the US from January to August 2024, about half by sea and half by air. In the same months of 2025 the total was €77.4 billion. In 2026 it was €28.1 billion.
Nearly all of that swing went by air and sat under one heading: hormones, HS 2937. EU exports of hormones to the US by air came to €5.5 billion in January to August 2024 and €39.9 billion a year later. March 2025 alone brought €15.7 billion. Ireland shipped €39.7 billion of the €39.9 billion. That was the rush ahead of US tariffs: Ireland’s own statistics show exports to the US up almost fivefold in March 2025, nearly all of it chemicals and pharmaceuticals[2]. The EU–US framework of August 2025 set a 15% ceiling on most EU goods and kept generic drug ingredients and chemical precursors at the normal MFN rate[3]. In April 2026 the US put a Section 232 tariff on patented drugs and their ingredients, at 15% for the EU[4]. Hormone exports by air spiked again in September 2025, at €11.2 billion, and in January to August 2026 came to €0.6 billion.
Hormones and nitrogen heterocyclic compounds (HS 2933), two headings that mostly hold active drug ingredients, explain €10.1 billion of the €10.5 billion fall in air value between 2024 and 2026. Customs data can’t say whether those products now cross under a different heading, are made in the US, or simply aren’t shipped. Air tonnage tells a different story from air value. It rose from 81,000 tonnes to 95,000.
EU chemical exports to the US by mode, by month, January 2024 to August 2026
Value, € billion. Chemicals are HS chapters 28–39 without pharmaceutical products (chapter 30). Road, rail and post, about 2% of value, are in the table and CSV but not drawn
Show the numbers as a table
| Month | Sea | Air, hormones | Air, other | Road, rail, post | Total |
|---|---|---|---|---|---|
| Jan 2024 | 2,374 | 869 | 1,708 | 87 | 5,038 |
| Feb 2024 | 2,543 | 223 | 1,642 | 93 | 4,501 |
| Mar 2024 | 2,876 | 197 | 2,232 | 93 | 5,398 |
| Apr 2024 | 2,788 | 332 | 1,693 | 107 | 4,920 |
| May 2024 | 2,911 | 786 | 1,766 | 111 | 5,574 |
| Jun 2024 | 2,558 | 124 | 2,807 | 91 | 5,580 |
| Jul 2024 | 3,043 | 1,193 | 1,177 | 89 | 5,502 |
| Aug 2024 | 2,633 | 1,792 | 1,473 | 110 | 6,008 |
| Sep 2024 | 2,526 | 2,428 | 1,901 | 80 | 6,935 |
| Oct 2024 | 2,665 | 2,884 | 1,145 | 311 | 7,005 |
| Nov 2024 | 2,864 | 2,925 | 1,290 | 93 | 7,172 |
| Dec 2024 | 3,113 | 831 | 1,358 | 100 | 5,402 |
| Jan 2025 | 2,407 | 8,070 | 1,656 | 111 | 12,244 |
| Feb 2025 | 2,778 | 8,256 | 2,013 | 102 | 13,149 |
| Mar 2025 | 2,979 | 15,666 | 5,259 | 110 | 24,014 |
| Apr 2025 | 2,936 | 2,826 | 2,244 | 94 | 8,100 |
| May 2025 | 2,381 | 5,016 | 1,207 | 101 | 8,705 |
| Jun 2025 | 2,273 | 18 | 1,905 | 95 | 4,291 |
| Jul 2025 | 2,397 | 31 | 1,508 | 121 | 4,057 |
| Aug 2025 | 1,653 | 10 | 1,150 | 62 | 2,875 |
| Sep 2025 | 2,379 | 11,163 | 839 | 89 | 14,470 |
| Oct 2025 | 1,944 | 33 | 991 | 89 | 3,057 |
| Nov 2025 | 1,805 | 60 | 1,001 | 164 | 3,030 |
| Dec 2025 | 1,886 | 11 | 747 | 80 | 2,724 |
| Jan 2026 | 1,768 | 22 | 876 | 67 | 2,733 |
| Feb 2026 | 2,322 | 30 | 1,440 | 73 | 3,865 |
| Mar 2026 | 2,372 | 83 | 1,523 | 92 | 4,070 |
| Apr 2026 | 2,095 | 81 | 871 | 99 | 3,146 |
| May 2026 | 2,029 | 67 | 929 | 84 | 3,109 |
| Jun 2026 | 2,410 | 77 | 1,088 | 82 | 3,657 |
| Jul 2026 | 2,847 | 97 | 1,359 | 87 | 4,390 |
| Aug 2026 | 2,103 | 104 | 871 | 79 | 3,157 |
By weight: the tankers emptied
By sea, EU chemical exports to the US fell from 5.52 million tonnes in January to August 2024 to 4.76 million in 2025 and 4.49 million in 2026, down 19%. In 2026 air carried 2% of the weight, and road, rail and post together 3%.
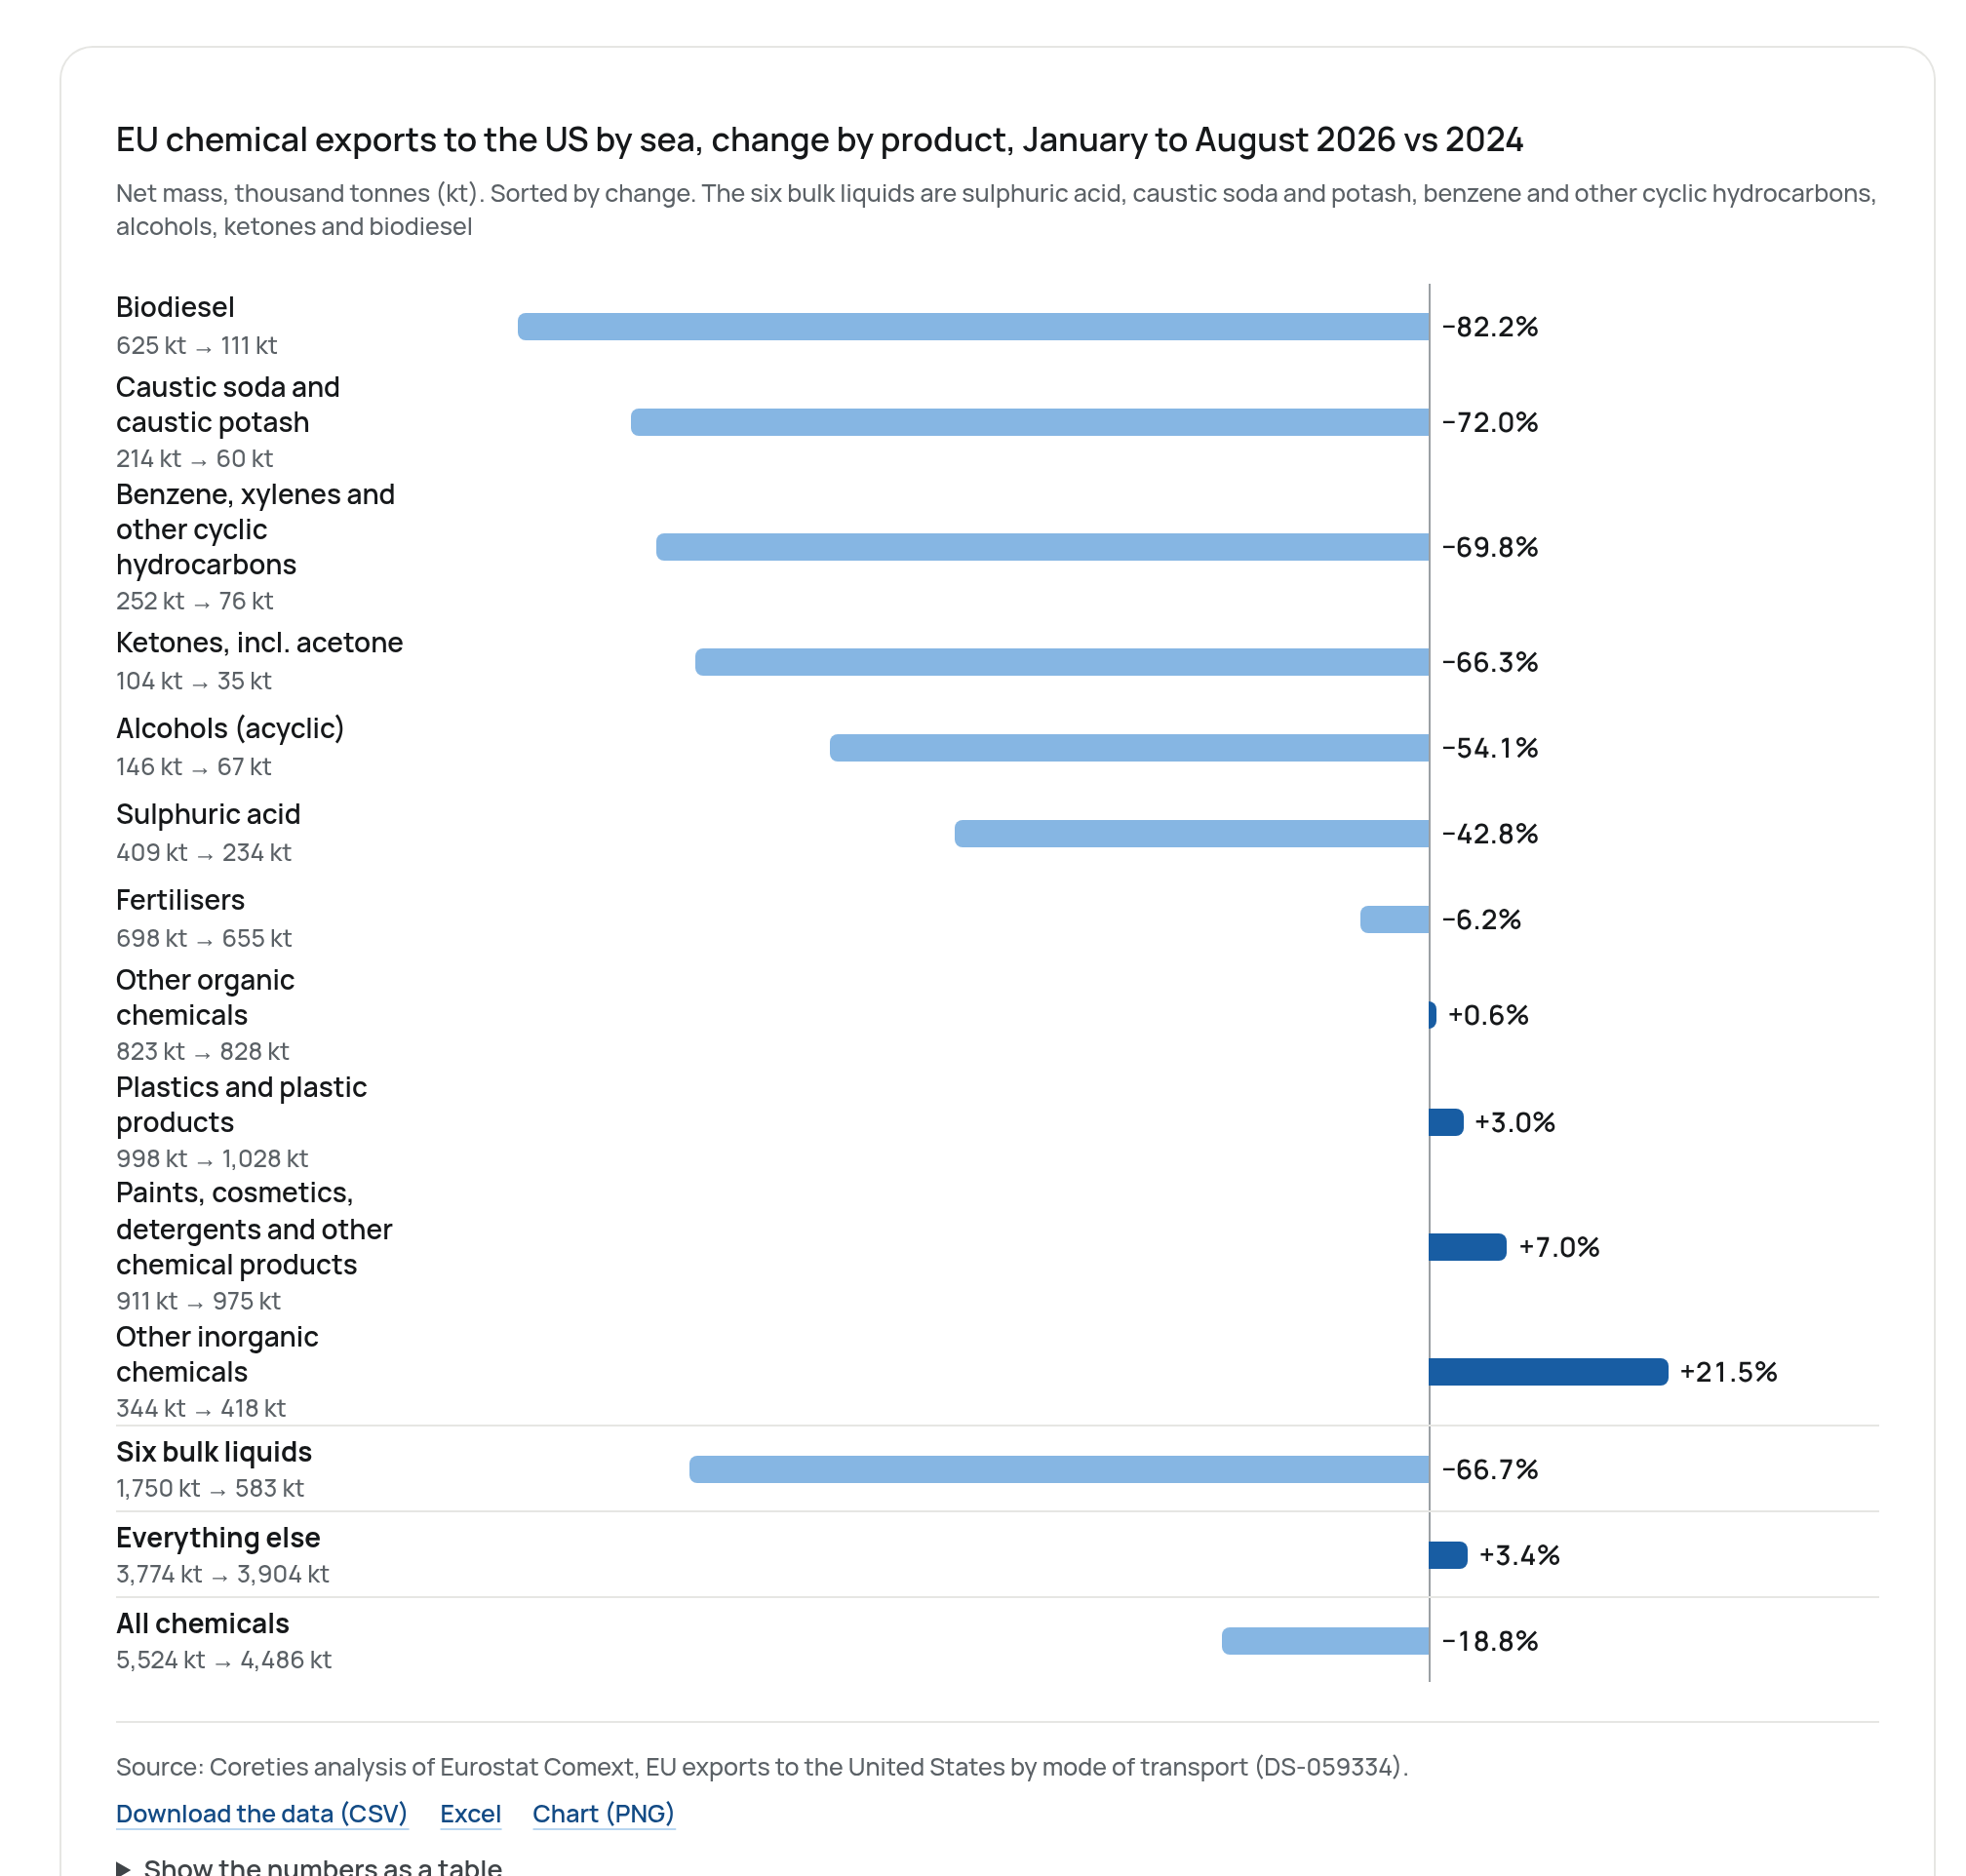
Six products explain all of the drop, and all six are liquids that mostly move in bulk by tanker. Biodiesel fell 82%, from 625,000 tonnes to 111,000, after next to nothing in 2025. Since January 2025 the US clean fuel production credit only applies to fuel made in the US, and US biodiesel imports fell sharply that year[5]. Caustic soda and potash fell 72%, benzene, xylenes and other cyclic hydrocarbons 70%, ketones such as acetone 66%, alcohols 54% and sulphuric acid 43%. Together they went from 1.75 million tonnes to 583,000.
These are commodity chemicals. Cefic counts 37 million tonnes of European chemical capacity closures announced since 2022, mostly in petrochemicals and basic inorganics[6]. Everything else the EU sends the US by sea rose 3.4%, from 3.77 million tonnes to 3.90 million. Plastics rose 3%; paints, cosmetics, detergents and other chemical products 7%; other inorganic chemicals 22%. Fertilisers slipped 6%.
EU chemical exports to the US by sea, change by product, January to August 2026 vs 2024
Net mass, thousand tonnes (kt). Sorted by change. The six bulk liquids are sulphuric acid, caustic soda and potash, benzene and other cyclic hydrocarbons, alcohols, ketones and biodiesel
Show the numbers as a table
| Product (HS) | Jan–Aug 2024 | Jan–Aug 2025 | Jan–Aug 2026 | 2026 vs 2024 |
|---|---|---|---|---|
| Biodiesel (3826) | 625 | 1 | 111 | −82.2% |
| Caustic soda and caustic potash (2815) | 214 | 68 | 60 | −72.0% |
| Benzene, xylenes and other cyclic hydrocarbons (2902) | 252 | 140 | 76 | −69.8% |
| Ketones, incl. acetone (2914) | 104 | 44 | 35 | −66.3% |
| Alcohols (acyclic) (2905) | 146 | 137 | 67 | −54.1% |
| Sulphuric acid (2807) | 409 | 270 | 234 | −42.8% |
| Fertilisers (31) | 698 | 869 | 655 | −6.2% |
| Other organic chemicals (29 rest) | 823 | 774 | 828 | +0.6% |
| Plastics and plastic products (39) | 998 | 1,033 | 1,028 | +3.0% |
| Paints, cosmetics, detergents and other chemical products (32–38 rest) | 911 | 949 | 975 | +7.0% |
| Other inorganic chemicals (28 rest) | 344 | 469 | 418 | +21.5% |
| Six bulk liquids (2807, 2815, 2902, 2905, 2914, 3826) | 1,750 | 660 | 583 | −66.7% |
| Everything else | 3,774 | 4,094 | 3,904 | +3.4% |
| All chemicals (28–39 excl. 30) | 5,524 | 4,755 | 4,486 | −18.8% |
What the manifests show
Coreties reads US inbound ocean manifests, so we looked at ships loaded at EU ports and arriving in the US from March to August of each year. We left out January and February, because our manifest feed is incomplete for February 2026. We counted liquid bulk bills of lading that carry chemicals, leaving out fuels, crude oil, food oils and tank washings. We call each one a chemical tanker parcel.
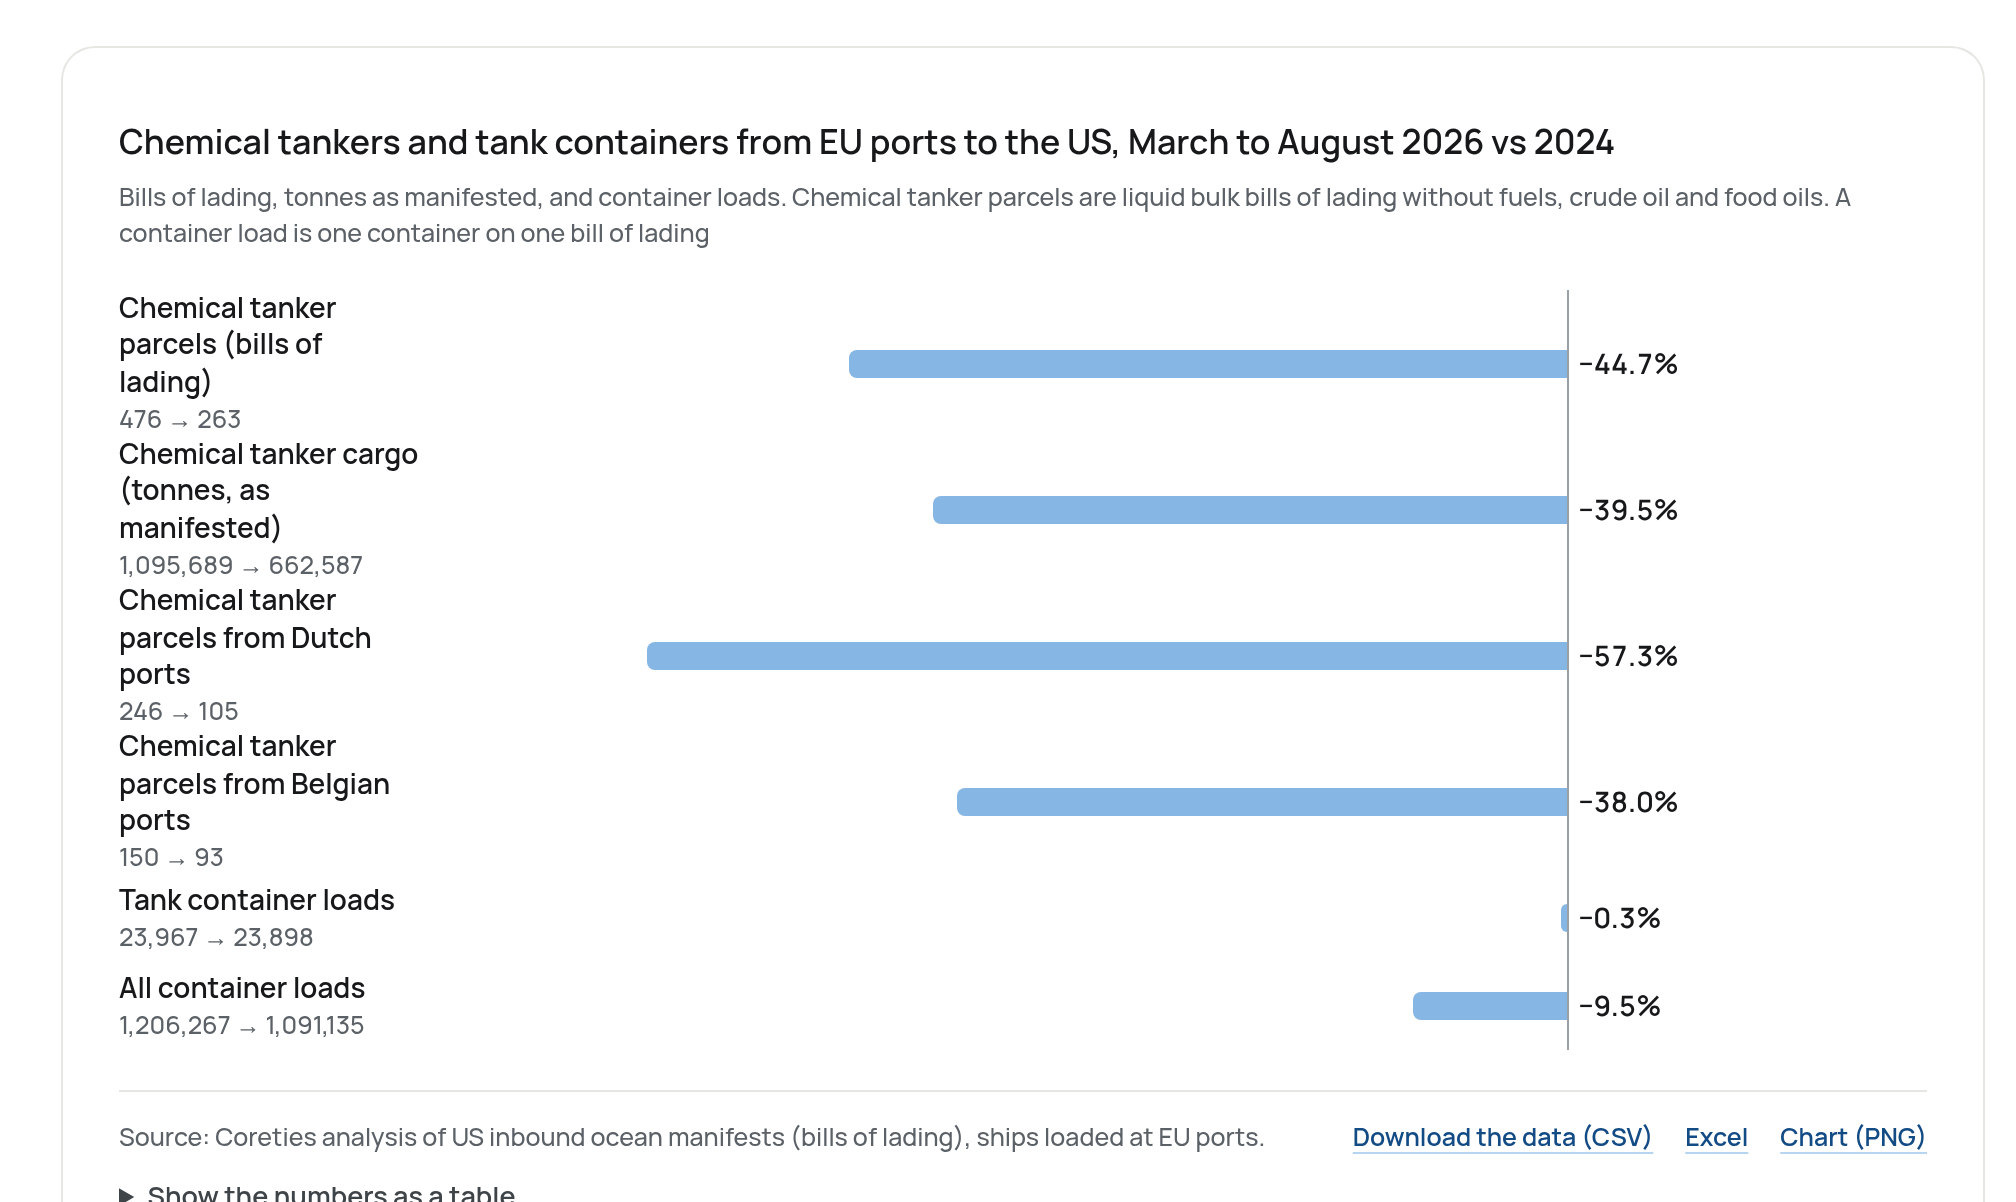
Those parcels fell from 476 in March to August 2024 to 416 in 2025 and 263 in 2026, down 45%. The tonnes on them fell 40%, from 1.10 million to 0.66 million. Parcels loaded in Dutch ports fell 57%, from 246 to 105, and in Belgian ports 38%, from 150 to 93. Eurostat’s figures for the six bulk liquids over the same months show a 62% fall. The manifests come in lower because they also carry chemicals outside those six, such as isocyanates and amines, which held up better.
Tank containers did not follow the tankers. Loads of tank containers from EU ports to the US were 23,967 in March to August 2024 and 23,898 in 2026. All container loads from EU ports, for every kind of cargo, fell 9.5%.
Chemical tankers and tank containers from EU ports to the US, March to August 2026 vs 2024
Bills of lading, tonnes as manifested, and container loads. Chemical tanker parcels are liquid bulk bills of lading without fuels, crude oil and food oils. A container load is one container on one bill of lading
Show the numbers as a table
| Measure | 2023 | 2024 | 2025 | 2026 | 2026 vs 2024 |
|---|---|---|---|---|---|
| Chemical tanker parcels (bills of lading) | 406 | 476 | 416 | 263 | −44.7% |
| Chemical tanker cargo (tonnes, as manifested) | 1,390,019 | 1,095,689 | 917,011 | 662,587 | −39.5% |
| Tank container loads | 20,062 | 23,967 | 24,762 | 23,898 | −0.3% |
| All container loads | 1,124,674 | 1,206,267 | 1,189,429 | 1,091,135 | −9.5% |
| Chemical tanker parcels from Dutch ports | 246 | 105 | −57.3% | ||
| Chemical tanker parcels from Belgian ports | 150 | 93 | −38.0% |
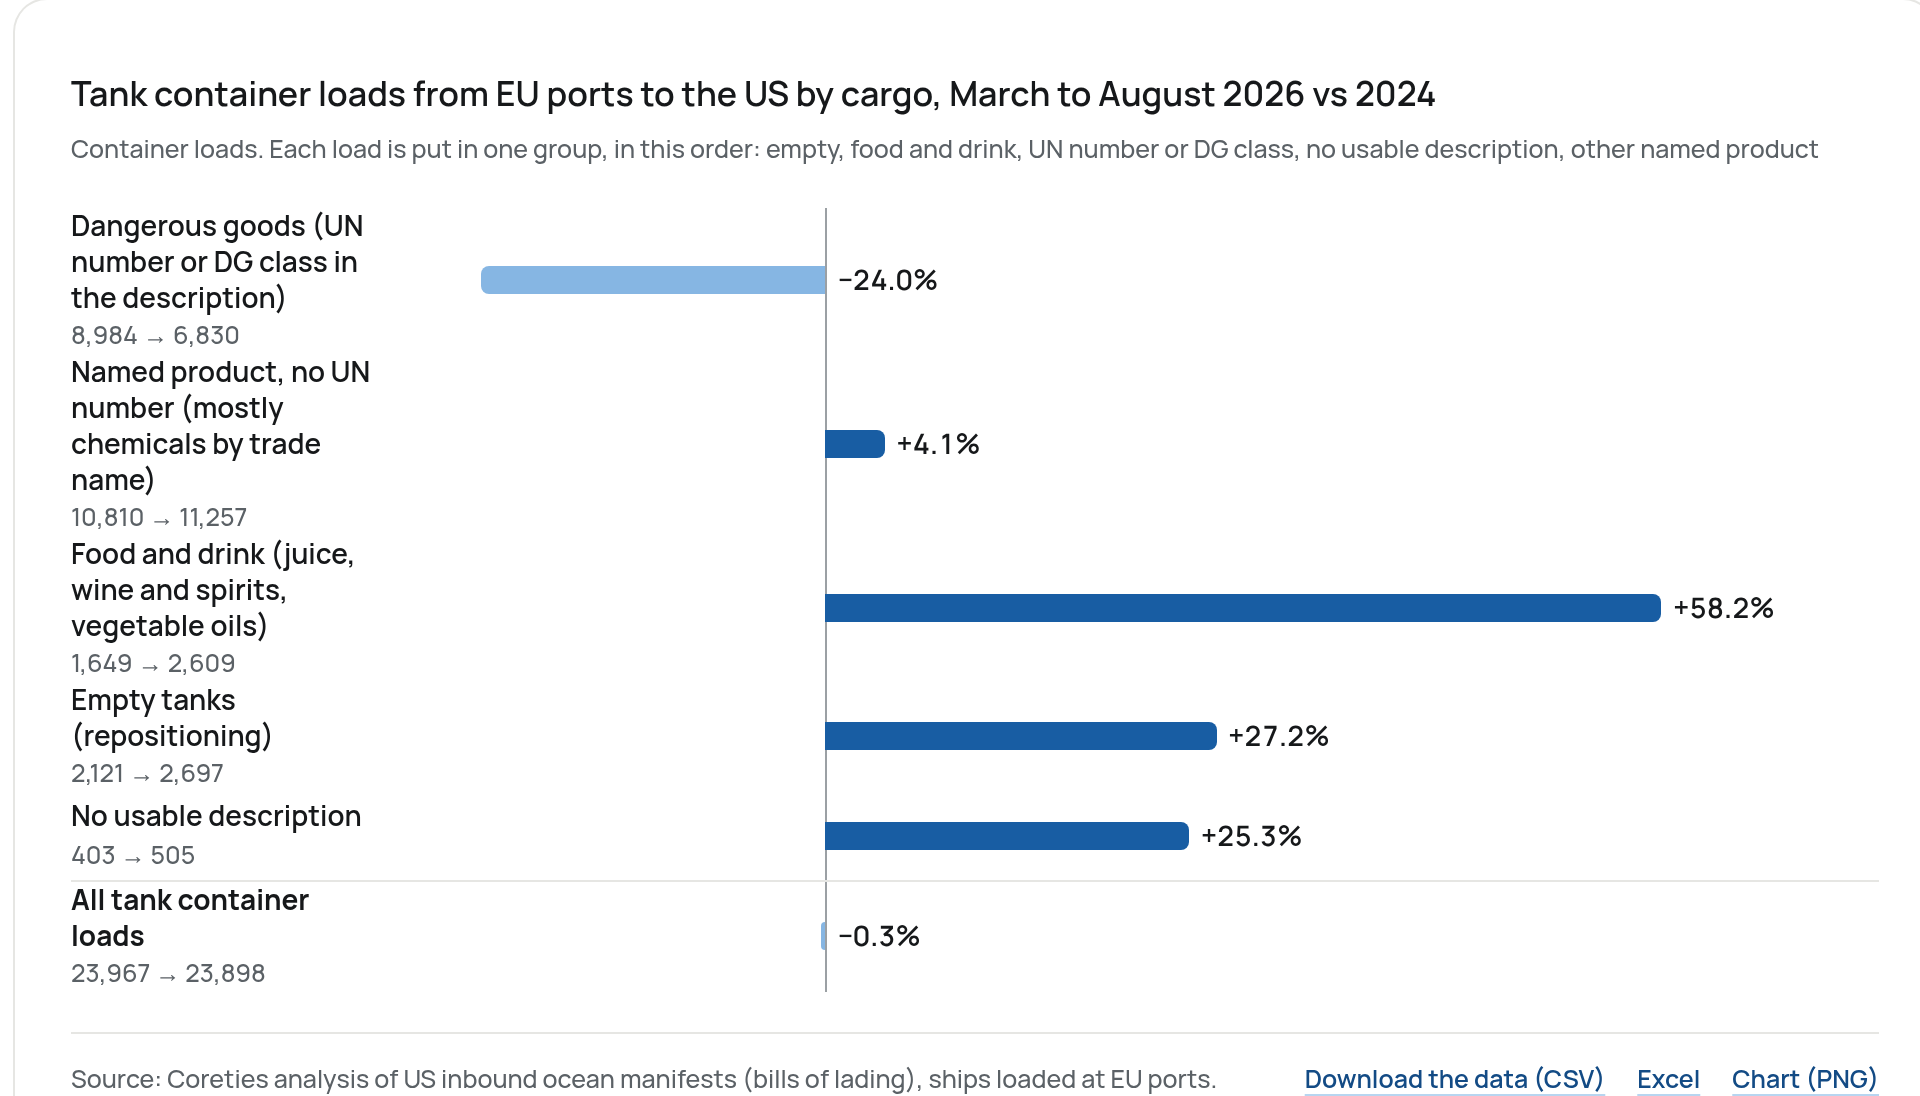
The number of tanks held, but what’s in them changed. We sorted each tank container load by its cargo description. Loads whose description carries a UN number or a dangerous goods class fell 24%, from 8,984 to 6,830. Named products without a UN number, most of them chemicals sold under trade names such as plasticisers, monomers and resins, rose 4% to 11,257. Food and drink in tanks (juice concentrate, wine and spirits, vegetable oils) rose 58%, from 1,649 to 2,609. Empty tanks going back rose 27% to 2,697, and about 500 loads a year carry no usable description. Rotterdam overtook Antwerp as the biggest loading port for tanks, with 8,909 loads against 7,332, while Le Havre fell 44%. On the US side Houston took the most in both years, about 7,000. We did not split the chemicals further by product family, because trade names don’t map reliably to one.
Tank container loads from EU ports to the US by cargo, March to August 2026 vs 2024
Container loads. Each load is put in one group, in this order: empty, food and drink, UN number or DG class, no usable description, other named product
Show the numbers as a table
| Cargo | Mar–Aug 2024 | Mar–Aug 2026 | 2026 vs 2024 |
|---|---|---|---|
| Dangerous goods (UN number or DG class in the description) | 8,984 | 6,830 | −24.0% |
| Named product, no UN number (mostly chemicals by trade name) | 10,810 | 11,257 | +4.1% |
| Food and drink (juice, wine and spirits, vegetable oils) | 1,649 | 2,609 | +58.2% |
| Empty tanks (repositioning) | 2,121 | 2,697 | +27.2% |
| No usable description | 403 | 505 | +25.3% |
| All tank container loads | 23,967 | 23,898 | −0.3% |
What it means for forwarders
The tanker side of this trade has almost halved in two years. That hurts the chemical tanker owners and the charterers, not most forwarders. The cargo forwarders handle held up: ISO tanks are flat, and plastics, paints and the other chemicals that mostly go in boxes are up by sea. That is DG and FAK business, and it is still there.
The commodity liquids are a different story. Europe has announced a lot of closures in exactly those plants, and I don’t see those parcels coming back. If you work with chemical shippers in Rotterdam or Antwerp, find out which of them still ship tanks to the US and which stopped.
What we can and can’t say
The falls by product and mode are in the data. Why they happened is partly our reading. Plant closures and the biodiesel credit fit the timing, but customs data doesn’t carry reasons. Eurostat records the mode of transport at the EU border, so goods trucked to a port outside the EU before sailing would show as road. Values are in euros and not adjusted for prices. Manifest tonnes are as declared by the shipper and are less reliable than Eurostat’s net mass, which is why we lead with Eurostat for tonnage and use the manifests for the split between tankers and containers.
Data and method
Eurostat Comext dataset DS-059334, extra-EU trade by mode of transport, reporter European Union (27 countries), partner United States, flow export, January 2023 to August 2026, value in euros and net mass in kilograms, retrieved on 10 November 2026. Chemicals are HS chapters 28 to 39 without chapter 30. Product groups use HS headings; confidential headings (28XX, 29XX and so on) are in the “other” group of their chapter. “Road, rail and post” also covers fixed installations, inland waterways and unknown modes.
US inbound ocean manifests: bills of lading for ships whose port of loading is in the EU, by date of arrival in the US, March to August 2023 to 2026. A chemical tanker parcel is a liquid bulk bill of lading whose cargo description doesn’t name a fuel, crude oil, a food oil or tank washings. Tonnes are the declared weight, excluding single bills over 60,000 tonnes. A container load is one container on one bill of lading; tank containers are those whose ISO size-type code marks a tank. Tank loads are grouped by keywords in the cargo description, in this order: empty, food and drink, a UN number or dangerous goods class, no usable description, and otherwise a named product. No shipper, consignee, carrier or brand is identified.
The chart data, as CSV:
- EU chemical exports to the US by mode, by month, January 2024 to August 2026eu-chemical-exports-to-us-by-mode-monthly-2024-2026.csv
- EU chemical exports to the US by mode, January to August 2023 to 2026eu-chemical-exports-to-us-by-mode-jan-aug-2023-2026.csv
- EU chemical exports to the US by sea, by product, January to August 2024 to 2026eu-chemical-exports-to-us-by-sea-by-product-jan-aug-2024-2026.csv
- Chemical tanker parcels and container loads from EU ports to the US, March to August 2023 to 2026eu-to-us-chemical-tankers-and-tank-containers-mar-aug-2023-2026.csv
- Tank container loads from EU ports to the US by cargo, March to August 2024 and 2026eu-to-us-tank-container-loads-by-cargo-mar-aug-2024-2026.csv
The same five tables in one Excel workbook: eu-us-chemical-exports-by-mode-2026.xlsx. Each chart also downloads as a PNG from its caption.
Cite as: Iaccarino, T. (2026). “Europe’s bulk chemical shipments to the US fell by two-thirds. Tank containers held steady.” Coreties Research, coreties.com/research/eu-us-chemical-exports-by-mode-2026.
References
- [1]Eurostat, “Extra-EU trade since 2002 by mode of transport, by HS2-4-6” (DS-059334), updated 16 Oct 2026 ec.europa.eu
- [2]Central Statistics Office (Ireland), “Goods Exports and Imports March 2025”, 15 May 2025 cso.ie
- [3]European Commission, “Joint Statement on a United States-European Union framework on an agreement on reciprocal, fair and balanced trade”, 21 Aug 2025 policy.trade.ec.europa.eu
- [4]The White House, “Fact Sheet: President Donald J. Trump … Imposing Tariffs on Patented Pharmaceutical Products”, 2 Apr 2026 whitehouse.gov
- [5]U.S. Energy Information Administration, “U.S. biodiesel and renewable diesel imports fall sharply in 2025 after tax credit change”, 4 Sep 2025 eia.gov
- [6]Cefic, “European Chemical Closures & Investments Radar 2022-2025”, 28 Jan 2026 cefic.org
Coreties tracks these lanes, from tanker parcels to container loads, for freight forwarders. See the data.