Boost Freight: Performance Benchmarking Guide
Your team is probably already benchmarking performance. You just may not be calling it that. A sales manager looks at reply rates from last month and says a lane campaign underperformed. An operations lead sees margin tightening on a port pair and assumes carrier costs are the reason. A commercial director compares one rep against […]
Your team is probably already benchmarking performance. You just may not be calling it that.
A sales manager looks at reply rates from last month and says a lane campaign underperformed. An operations lead sees margin tightening on a port pair and assumes carrier costs are the reason. A commercial director compares one rep against another without checking account mix, shipment complexity, or timing. Those are performance checks, but they aren't yet performance benchmarking.
The problem is that informal checks usually mix too many variables. They compare the wrong periods, use inconsistent data, and stop at surface-level numbers. In freight, that gets expensive fast. You can push budget into a lane that only looked strong because of a short-term spike, or judge a rep unfairly because one book of business had cleaner data and easier targets.
Good benchmarking gives commercial and operations teams a shared way to answer one question: where are we underperforming, why, and what should we change next? In logistics, that means moving past one-off scorecards and building a rhythm of trend analysis, fair comparisons, and follow-through.
Setting the Stage for Meaningful Benchmarks
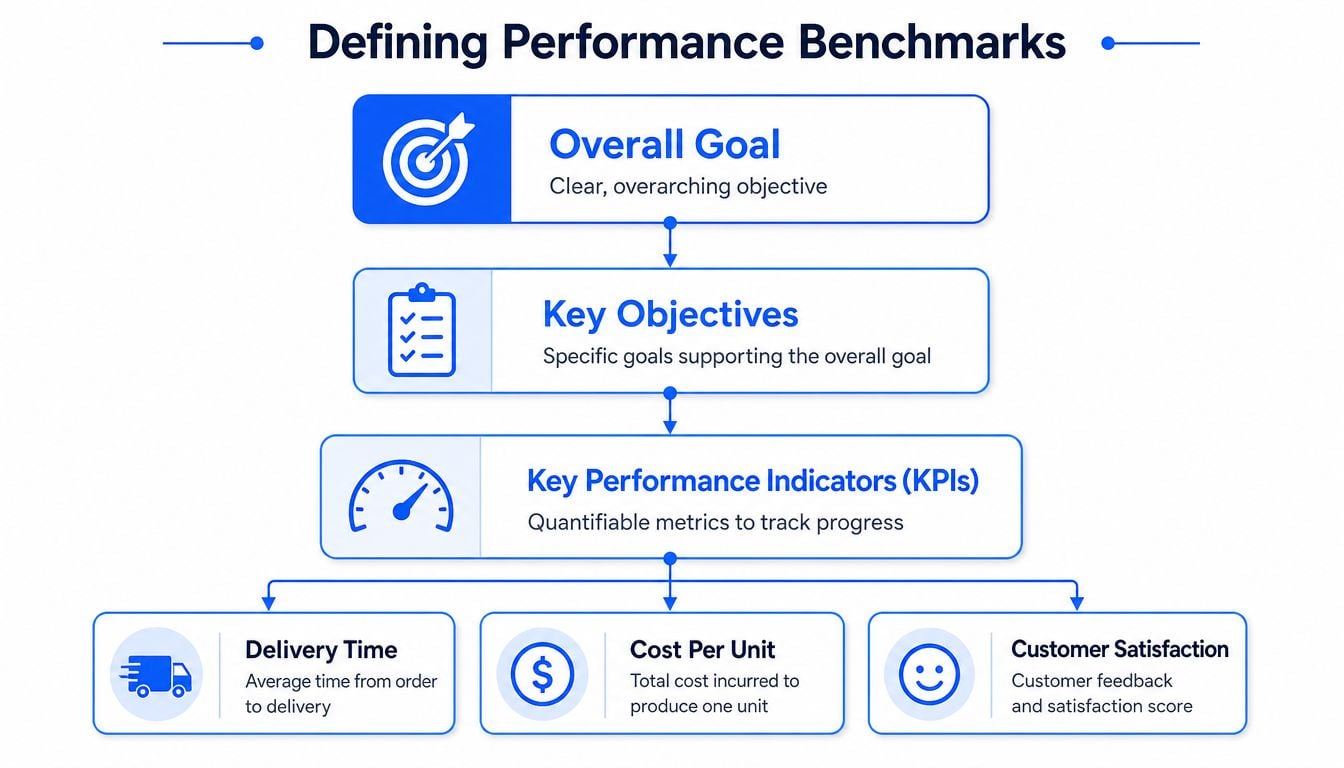
Most failed benchmarking efforts start with a fuzzy target. “Improve sales productivity” sounds fine in a meeting, but nobody can benchmark against it. You need a definition of good performance that can survive contact with real freight data.
Industry-standard benchmarking treats this as a structured process, not a casual review. Performance benchmarking is a systematic 5-step cycle: Plan, Set-Up, Collect, Analyze, and Act. Organizations that stick to the full cycle turn benchmarking into a repeatable improvement habit rather than a one-time report, as outlined by APQC's benchmarking framework.
Why informal performance checks break down
In freight sales, teams often track whatever is easy to pull from the CRM. Email volume. Calls made. Meetings booked. Quotes sent. Those metrics aren't useless, but on their own they don't tell you whether the business is getting healthier.
A rep can send a high volume of emails into the wrong accounts. A branch can book more meetings while winning lower-quality freight. A lane can show volume growth while margin weakens. If the KPI doesn't connect to commercial or operational outcomes, it becomes a vanity metric.
Practical rule: If a KPI can't change a decision on pricing, account targeting, lane focus, or rep coaching, it shouldn't sit at the center of your benchmark.
The five-step cycle fixes that by forcing discipline. Plan defines the business question. Set-Up chooses the measures. Collect builds a reliable dataset. Analyze explains the gap. Act turns the finding into a change with ownership.
Skip Analyze and you only get scorekeeping. Skip Act and the dashboard becomes decoration.
KPIs that matter in freight
A useful benchmark set combines sales activity, commercial quality, and operational follow-through. That mix matters because logistics teams win business in sales conversations but keep it through execution.
A practical starter set for freight forwarders, carriers, and 3PL teams usually includes:
- Prospecting quality such as outreach-to-meeting conversion rate by shipper segment, lane, or territory
- Pipeline quality such as quote-to-win rate, win reasons, and time from first contact to qualified opportunity
- Lane economics such as lane profitability, yield consistency, and account concentration by trade lane
- Customer retention signals such as repeat booking patterns, complaint themes, and service recovery cycles
- Execution measures such as delivery time consistency, exception rates, and handoff speed between sales and operations
A simple benchmark design
Start with one commercial objective and one operational outcome tied to it.
For example, if your goal is to grow import business on a port pair, your benchmark should not stop at outbound email response. It should connect prospecting activity to qualified meetings, quoted opportunities, won shipments, and lane performance after go-live. That creates a chain of evidence instead of a shallow snapshot.
A simple setup often looks like this:
- Define the business goal such as improving performance on a target lane or shipper segment.
- Choose a small KPI set that reflects both selling and execution.
- Assign owners so sales, pricing, and operations agree on definitions.
- Decide the review rhythm weekly for activity, monthly or quarterly for outcome trends.
- Predefine action triggers so the team knows what happens when a metric moves off target.
That's the difference between reporting and management. Reporting tells you what happened. Benchmarking tells you what to do next.
Sourcing and Normalizing Your Logistics Data
More data doesn't automatically produce better benchmarking. In freight, it often does the opposite.
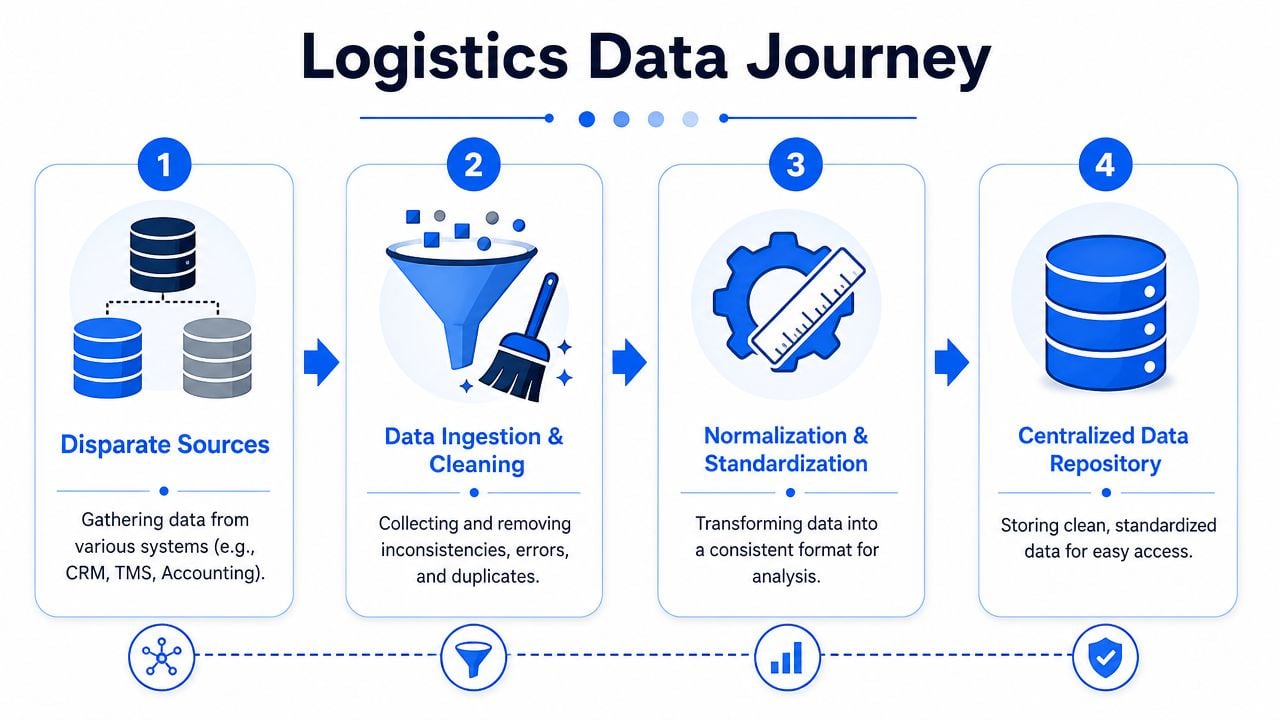
Teams pull customs records, CRM logs, TMS activity, quoting history, finance data, and rep notes into one spreadsheet and assume the size of the dataset makes it reliable. It doesn't. If company names vary, shipment records are duplicated, and one lane has deep history while another is brand new, your benchmark can look precise while being badly distorted.
Start with source discipline
For logistics teams, the core source groups are usually straightforward:
- Commercial systems including CRM stages, outreach logs, meeting outcomes, and account ownership
- Operational systems including TMS milestones, routing choices, exceptions, and shipment completion data
- Financial systems including quoted rates, invoiced revenue, and margin by customer or lane
- Market intelligence sources including customs-derived shipment visibility and trade lane activity
What trips teams up isn't access. It's consistency.
One shipper may appear under multiple names across customs records and CRM entries. A lane may be tagged by port pair in one system and by country pair in another. A rep may log meetings carefully while another leaves half the activity in email. If you compare those records without cleaning them first, you aren't benchmarking performance. You're benchmarking documentation habits.
Clean before you compare
Use a standard cleaning pass before any benchmark review.
- Resolve entity names by mapping parent companies, subsidiaries, spelling variations, and acquired brands into one record structure.
- Standardize lane definitions so everyone means the same thing when they talk about a trade lane, corridor, or service scope.
- Remove duplicate events especially where the same shipment or outreach touch appears across multiple tools.
- Separate missing from zero because “no activity recorded” and “activity happened with zero outcome” are not the same operational reality.
A strong primer on structuring supply chain data sources is this guide to supply chain databases, which is useful when you're combining commercial and operational records.
Later in the workflow, route context matters too. If you're benchmarking drayage and container handoff performance around congested gateways, practical operational examples such as optimizing Felixstowe with Haulier.AI help teams understand why local conditions can distort raw comparisons.
Normalize for fair comparisons
This is the part many teams skip, and it's where weak benchmarking usually falls apart.
Research on benchmarking performance indices warns that methods often fail when they “ignore sample size effects or use aggregate data”, which leads to misleading comparisons, especially in logistics where reporting standards and data volumes vary widely. That caution is highlighted in this analysis of benchmarking pitfalls.
A lane with a long booking history and a lane you're just developing should not be judged by the same raw output logic.
If one rep works a mature vertical with dense customs visibility and another works newer accounts with sparse records, raw response rates or win counts can mislead. You need normalization rules that account for uneven exposure and uneven data quality.
Practical normalization options include:
- Cohort-based comparison where you compare similar lanes, customer segments, or account maturity groups instead of the whole book at once
- Rate-based metrics rather than raw counts, provided the denominator is clean and consistent
- Minimum observation thresholds before you treat any pattern as benchmark-worthy
- Weighted interpretation where results from thin datasets are treated more cautiously than results from well-established activity streams
A short technical explainer can help teams visualize this data-handling step before they build dashboards.
The main lesson is simple. Clean data beats big data. Fair comparison beats fast comparison.
Building Your Comparison Cohorts and Dashboard
Once the data is clean, the next job is grouping it properly. Most freight teams don't need a bigger dashboard. They need better comparison cohorts.
A cohort is the peer group you use for comparison. If that group is wrong, every conclusion after it is shaky. Comparing a new trade lane against a mature one, or a specialist rep against a broad-market rep, usually creates noise disguised as insight.
Cohorts that actually help decisions
Use internal and external cohorts for different questions.
Internal benchmarking works best when you're trying to improve execution consistency. Compare one period against another, one branch against another, or one rep's performance against peers handling similar account types. Such comparisons make quarter-over-quarter lane performance, response rate by segment, or quote turnaround by office especially useful.
External benchmarking helps when the question is market position. That could mean comparing your activity and results against visible trade patterns in customs data, or against a competitor set operating in the same corridor and customer profile.
Useful logistics cohorts often include:
- Lane cohorts by port pair, country pair, or service mode
- Customer cohorts by industry, shipment frequency, or import/export profile
- Sales cohorts by territory, tenure, or account mix
- Operational cohorts by branch, carrier partner set, or handoff model
What the dashboard should show
The dashboard's job is to shorten the time between signal and action. It should let a sales manager or commercial director answer three questions quickly: where are we off track, where are we improving, and where should we intervene first?
A useful logistics dashboard usually includes a mix of commercial and operational views, such as:
- target lanes with increasing or weakening engagement
- outreach response rate by rep or territory
- quote conversion by shipper segment
- new-customer shipment quality after onboarding
- margin direction by lane or customer cohort
Don't overload the screen. If every KPI is “critical,” nothing is.
| Category | KPI | What It Measures |
|---|---|---|
| Sales Activity | Outreach-to-meeting conversion | How effectively outbound prospecting creates qualified conversations |
| Pipeline Quality | Quote-to-win rate | How often pricing activity turns into booked business |
| Lane Performance | Lane profitability | Commercial health of a specific trade lane or corridor |
| Customer Health | Repeat booking rate | Whether new and existing customers continue to place freight |
| Service Execution | Delivery time consistency | Reliability of shipment execution against expected transit performance |
| Account Economics | Customer acquisition cost | The effort and spend required to win a new shipper account |
| Team Performance | Outreach response rate by sales rep | Relative effectiveness of targeting, messaging, and follow-up |
Keep one source of truth
Dashboards fail when teams export data into side spreadsheets and start redefining terms by department. A quote in sales shouldn't mean one thing to the rep and another thing to finance. A qualified opportunity shouldn't shift definition by branch.
Operator's view: A benchmark only works when the room agrees on the denominator.
If your team debates the meaning of the KPI every month, the dashboard isn't ready for management use.
Analyzing Performance to Uncover Growth Opportunities
A dashboard tells you where to look. Analysis tells you where money is leaking.
That's why strong performance benchmarking focuses on the performance gap, which is the measurable difference between your current state and the best realistic benchmark for that process. Effective gap analysis also requires senior management involvement and a concrete action plan with responsibilities and deadlines, as described in this guidance on KPIs and benchmarking.
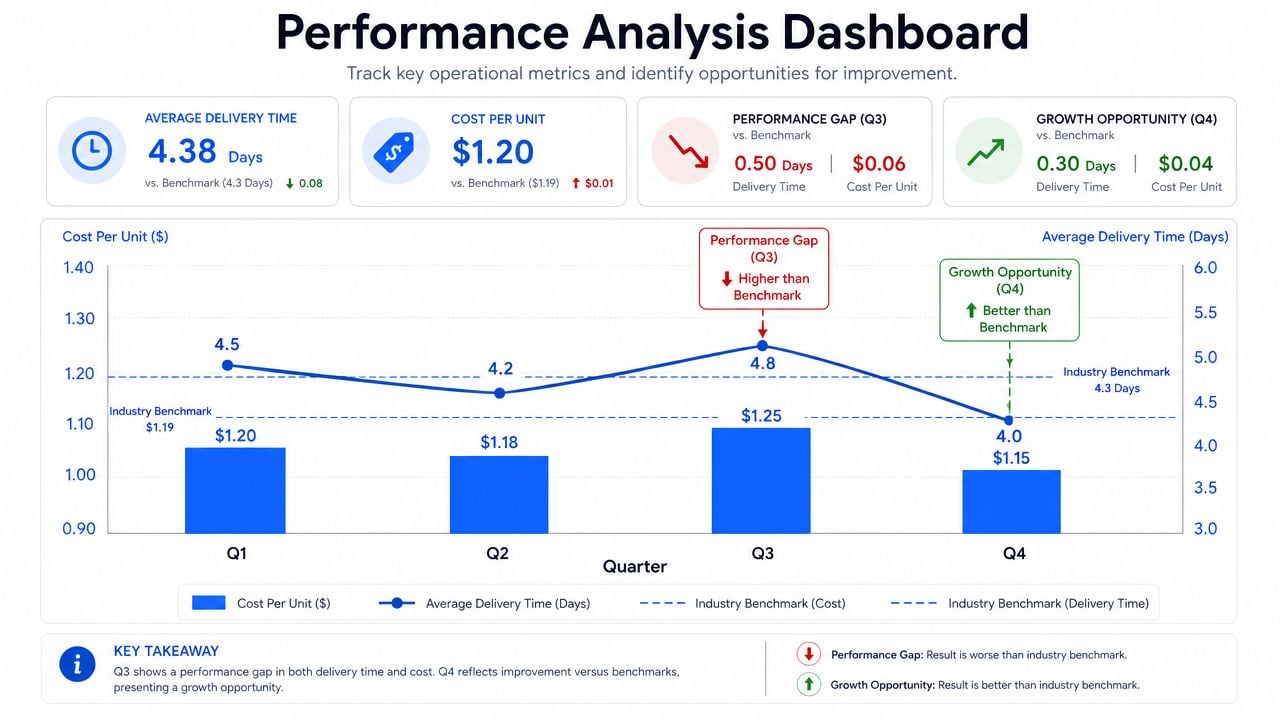
When response rates differ by rep
Say one rep gets more replies from importers on a target corridor than another. The weak analysis says the better rep writes stronger emails. Sometimes that's true. Often it isn't the full story.
Check the comparison in layers:
- Account mix. Are both reps targeting the same shipper size, commodity type, and lane density?
- Data quality. Does one rep have cleaner contact coverage and better decision-maker matches?
- Follow-up rhythm. Are touches spread consistently, or does one rep stop too early?
- Offer quality. Is one rep using stronger operational proof points such as routing options, port alternatives, or service detail?
That last point matters more than many teams admit. Logistics sales is not just copywriting. It's commercial relevance. If a rep can speak clearly to route options, handoff risks, or likely bottlenecks, the message usually lands better because it sounds operationally credible.
A useful supporting read here is predictive analytics for sales, especially for teams trying to connect prospecting patterns with likely pipeline outcomes.
When volume rises but profit softens
This is a classic freight problem. A lane looks healthy on paper because shipment count is up, but margin quality starts slipping. If you only benchmark volume, you'll call that growth. If you benchmark commercial performance properly, you'll see deterioration early.
Review the lane through multiple lenses:
- Pricing behavior to see whether win rates improved because the team discounted too aggressively
- Customer mix changes to identify whether lower-quality freight replaced better freight
- Operational cost pressure such as extra handling, poor routing, or recurring exception management
- Service promise mismatch where sales committed to a service pattern operations can't maintain profitably
If finance is part of that review, ratio thinking helps. Teams that want a cleaner way to assess the financial side of operational performance often benefit from broader guides such as Understanding SME cash flow ratios, especially when margin discussions drift into working-capital strain and collection timing.
Turn findings into action
Analysis isn't complete until it changes behavior. If the gap is poor response quality on a lane, the action may be tighter account selection, better routing intelligence in outreach, or clearer rep playbooks. If the gap is profitable growth, the action may be pricing guardrails, customer-tier rules, or stricter lane qualification.
Benchmarking earns trust when it identifies a gap, names the likely cause, and assigns the next move to a person, not a department.
That last point matters. “Sales and ops should align better” is not an action. “Pricing manager reviews low-yield wins on the corridor every Friday and rep leads adjust targeting by shipper type” is an action.
From Static Reports to Trend-Based Improvements
The biggest mistake in performance benchmarking is treating the report as the finish line.
One monthly scorecard can tell you whether a metric moved. It can't tell you whether the change is durable, seasonal, or misleading. In freight, that distinction matters because shipment flows rise and fall with tender cycles, port conditions, holidays, commodity timing, and customer buying patterns.
Experts in benchmarking stress the need to “look at a trend rather than just episodical or instantaneous numbers”. They also emphasize that rigorous benchmarking includes implementing targeted improvements and then re-testing to confirm the issue is resolved, as discussed in this benchmarking discussion.
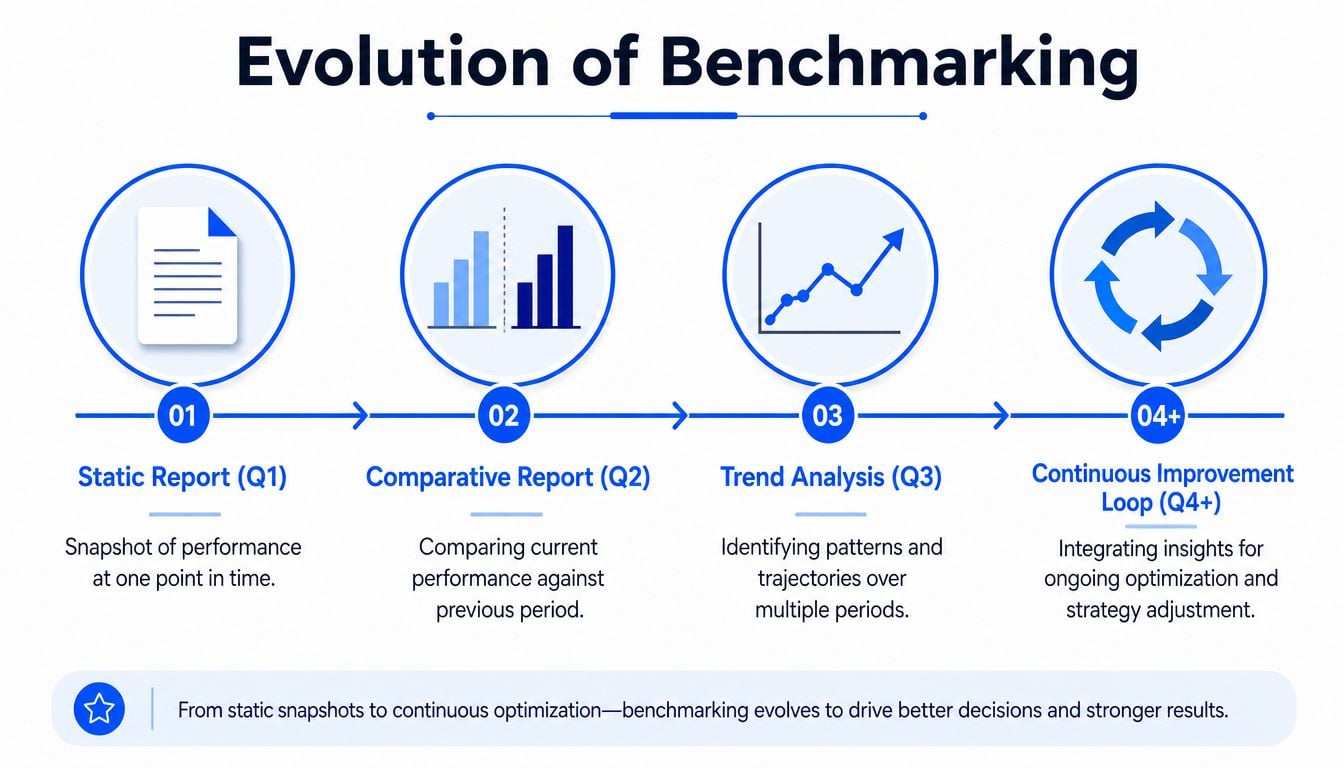
Why trend lines beat snapshots
A rep's response rate can jump after a strong week of highly targeted outreach. A lane can look stronger in a short window because one large shipper moved unusual volume. A branch can appear more efficient because it handled fewer exceptions during that period.
None of those signals are useless. But they need trend context.
Use trend-based benchmarking to ask:
- Is the improvement repeating across review periods?
- Did performance improve in one cohort only, or across comparable groups?
- Was the move tied to a specific intervention such as a new pitch, account filter, routing option, or pricing change?
- Did the gain hold after conditions normalized?
Don't reward a spike until it survives a second review cycle.
That mindset saves teams from overreacting. It also keeps budget and leadership attention focused on changes that compound.
Build the improvement loop
A strong loop has four motions: measure, interpret, change, and verify. The verification step is where many commercial teams go quiet. They launch a new talk track, update a target list, or add route alternatives to outreach, but they don't isolate whether the change improved results.
In logistics sales, one practical improvement might be giving reps stronger shipment visibility and route context before outreach. Another might be improving movement tracking so customer-facing teams can speak more confidently about service reliability. Broader operational visibility resources such as air and ground logistics tracking are useful when teams need better language and better evidence in customer conversations.
Handle seasonality and lag like an operator
Trend analysis in freight needs common-sense normalization. Compare like-for-like periods where possible. Treat short windows cautiously on low-volume lanes. Watch for lag between commercial activity and operational outcomes. A meeting booked now may not show up as a shipment pattern until later.
That means your review rhythm should separate leading and lagging measures.
A practical operating cadence often looks like this:
- Weekly for outreach quality, meetings, and quote flow
- Monthly for win quality, onboarding stability, and early margin behavior
- Quarterly for lane development, customer retention patterns, and account quality trends
When teams work this way, benchmarking stops being a reporting exercise. It becomes a management system.
Key Takeaways and Common Benchmarking Pitfalls
Performance benchmarking works when it helps your team make better decisions under real operating conditions. That's the standard. Not prettier reports. Not more tabs in a spreadsheet. Better decisions.
The strongest freight teams treat benchmarking as a commercial discipline tied directly to account selection, pricing behavior, lane focus, and service execution. They define what good looks like, clean the data before comparing it, build fair cohorts, analyze the gap, and keep reviewing trends after they make changes.
The weakest teams do the opposite. They compare raw totals across unequal books of business. They mix missing data with true zeroes. They celebrate activity that doesn't turn into profitable freight. Then they act surprised when the dashboard says one thing and the P&L says another.
Common pitfalls show up fast:
- Using vanity metrics like volume of outreach without checking whether it creates qualified, profitable opportunities
- Comparing unmatched cohorts such as mature lanes against developing ones, or clean datasets against messy ones
- Ignoring data quality especially entity matching, duplicate records, and inconsistent lane definitions
- Stopping at the report instead of assigning actions and checking whether the intervention worked
- Overreacting to short-term movement without enough trend context to separate signal from noise
There's also a leadership pitfall. Teams often delegate benchmarking downward and then expect transformation upward. That rarely works. Commercial managers, operations leads, and senior decision-makers need to agree on definitions, priorities, and action thresholds. If they don't, the process turns political instead of practical.
The payoff is simple. When you benchmark well, sales stops chasing the wrong accounts. Pricing spots weak wins sooner. Operations gets cleaner feedback on which promises are helping retention and which are hurting margin. The business learns faster.
That is why benchmarking isn't an admin task. It's a growth system for logistics teams that want repeatable decisions instead of guesswork.
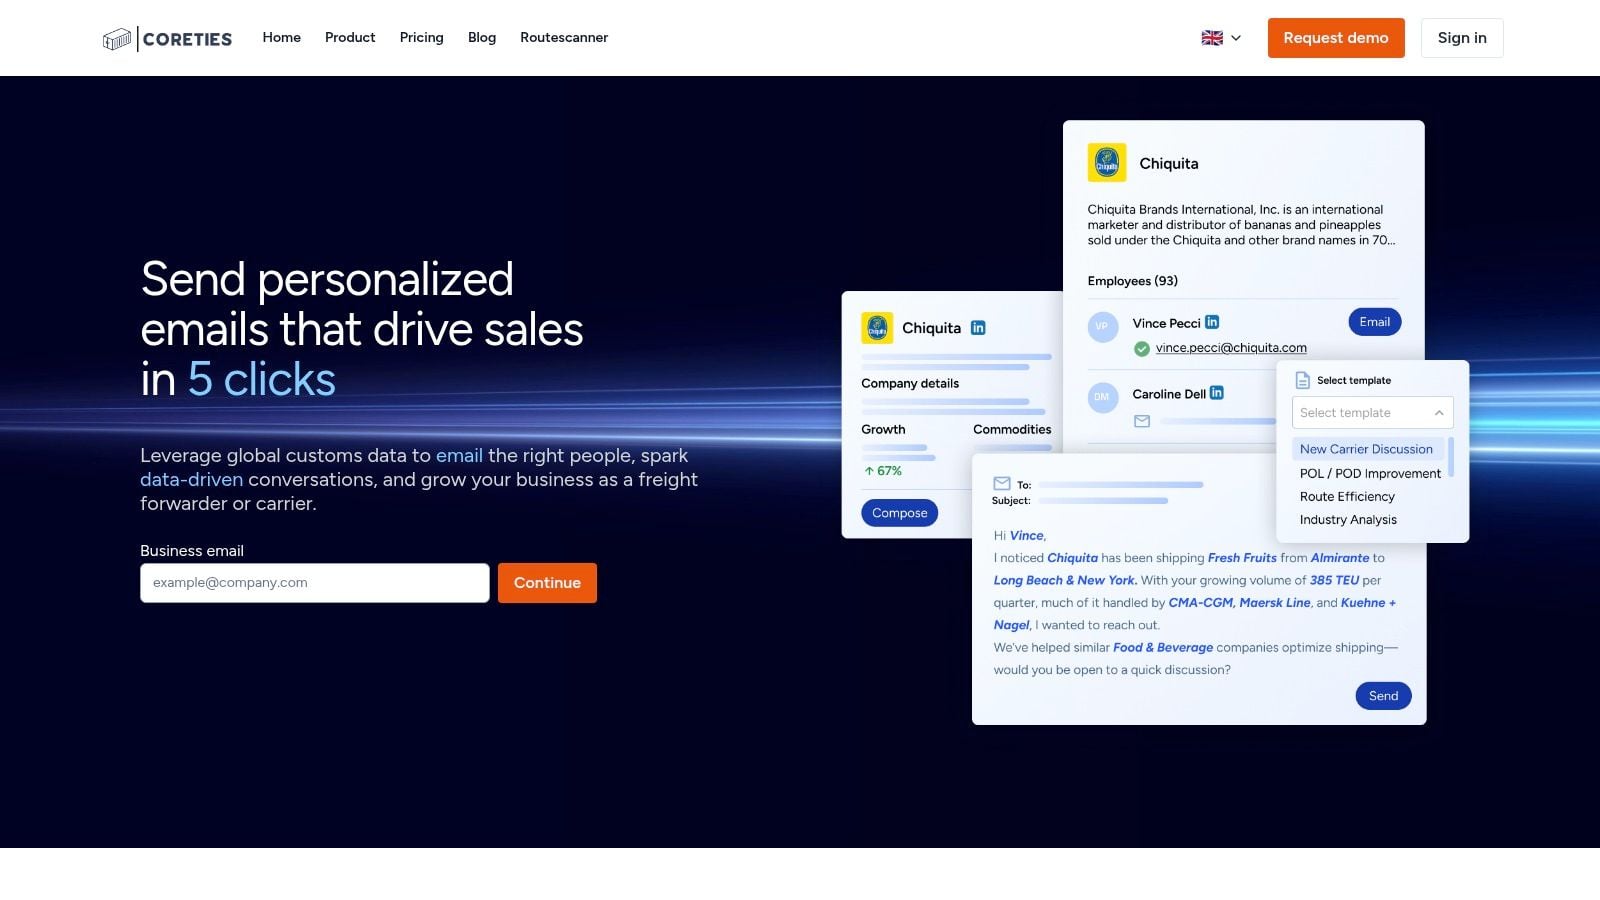
If your team wants a faster way to turn customs data into qualified freight prospects, targeted outreach, and lane-specific commercial insight, take a look at Coreties. It helps freight forwarders, carriers, and logistics sales teams find the right accounts, reach the right decision-makers, and build more relevant conversations around real trade flows.